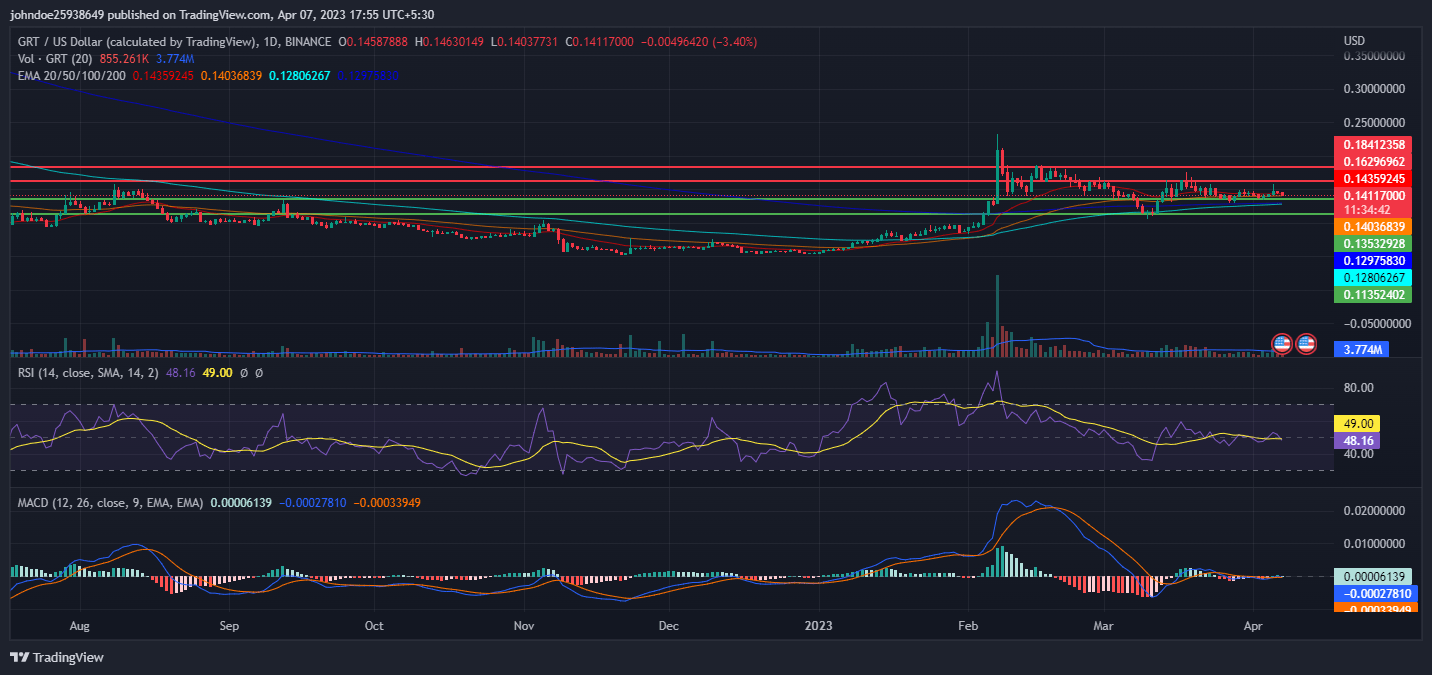
Cardano price analysis: ADA rallies above $0.4400 as buying pressure mounts

The latest Cardano price analysis has a positive outlook as the bulls have managed to take control of the market. The bulls have surged the price past the $0.4400 barrier and are looking to break above that level. ADA is currently exchanging hands at $0.4292, which is a 3.70% increase from yesterday’s close.
As the buying pressure mounts, ADA is facing resistance at $0.4441, which is the high of today’s trading session. If the bulls manage to break above this level then we could see ADA/USD find a new resistance level above the 0.4500 mark. On the other hand, if the bears gain control of the market and push the price below the $0.4126 support level, then it will be an indication of a change in trend and ADA/USD could dip further.
Cardano price analysis 1-day chart: ADA face resistance at $0.4441 amid Bullish momentum
The daily chart for Cardano price analysis shows that as long as the bulls remain in control, ADA/USD could continue its upward trend and break through resistance levels. The buyers were able to push the price from a low intraday of $0.4126 to a high of $0.4441 before the sellers forced the price to drop.
Technical indicators in this time frame suggest a bullish trend. The Moving Average Convergence Divergence (MACD) indicator on the daily chart shows an upward trend and bullish momentum building. The MACD line is well above the signal line and the histogram bar is increasing on the positive side.

ADA/USD 24-hour chart. Source: Trading View
The Relative Strength Index (RSI) indicator shows an increase in buying pressure as it has entered into an overbought zone. The RSI value stands at 71.02, which implies that ADA/USD could continue its upward trend. Moreover, the moving average (MA) indicator is trending below the green candlesticks, which is another sign of bullish momentum.
Cardano price analysis 4-hour chart: Recent developments and further indications
The hourly chart for Cardano price analysis shows a decline in ADA price as bears were able to penetrate the $0.4300 level. The selling pressure pushed the price to a low of $0.4292 as it is still holding above the $0.4200 level. The moving average (MA) is currently at 0.425 and the histogram is decreasing, with red bars developing in the chart.

ADA/USD 4-hour chart. Source: Trading View
The MACD indicator is still trending in line with bullish momentum as it has continued to remain above the signal line and its histogram bar is still in a positive outlook. The Relative Strength Index (RSI) stands at 64.23, indicating that selling pressure is still present in the market and ADA could drop further if the bears gain control of the market.
Cardano price analysis conclusion
Overall, Cardano’s price analysis shows that the bulls are in control of the market and ADA/USD could continue its upward trend as long as buyers remain in control. The pair could find further resistance at the $0.4441 mark and should it break above this level then the price could surge to a new high. On the other hand, if the sellers gain control of the market and push ADA/USD below the $0.4126 support level, then we could see a bearish trend develop in ADA.


 Bitcoin
  Ethereum
  Tether
  USDC
USDC  TRON
TRON  Dogecoin
  Cardano
  Bitcoin Cash
  Monero
  Chainlink
  LEO Token
  Stellar
  Zcash
Zcash  Litecoin
  Hedera
  Dai
Dai  Cronos
  OKB
OKB  Tether Gold
  Ethereum Classic
  KuCoin
  Cosmos Hub
  Gate
Gate  Algorand
  VeChain
  Dash
Dash  Tezos
Tezos  Stacks
  TrueUSD
  Decred
  IOTA
IOTA  Theta Network
  Basic Attention
  NEO
NEO  Synthetix
  Qtum
Qtum  0x Protocol
  Ravencoin
  Zilliqa
  DigiByte
  Nano
Nano  Siacoin
  Holo
Holo  Numeraire
  Waves
Waves  Enjin Coin
  Ontology
  Status
  BUSD
BUSD  Hive
Hive  Pax Dollar
  Lisk
Lisk  Steem
Steem  Huobi
Huobi  OMG Network
  Bitcoin Gold
  NEM
NEM