Dogecoin price analysis: DOGE/USD to break above $0.08

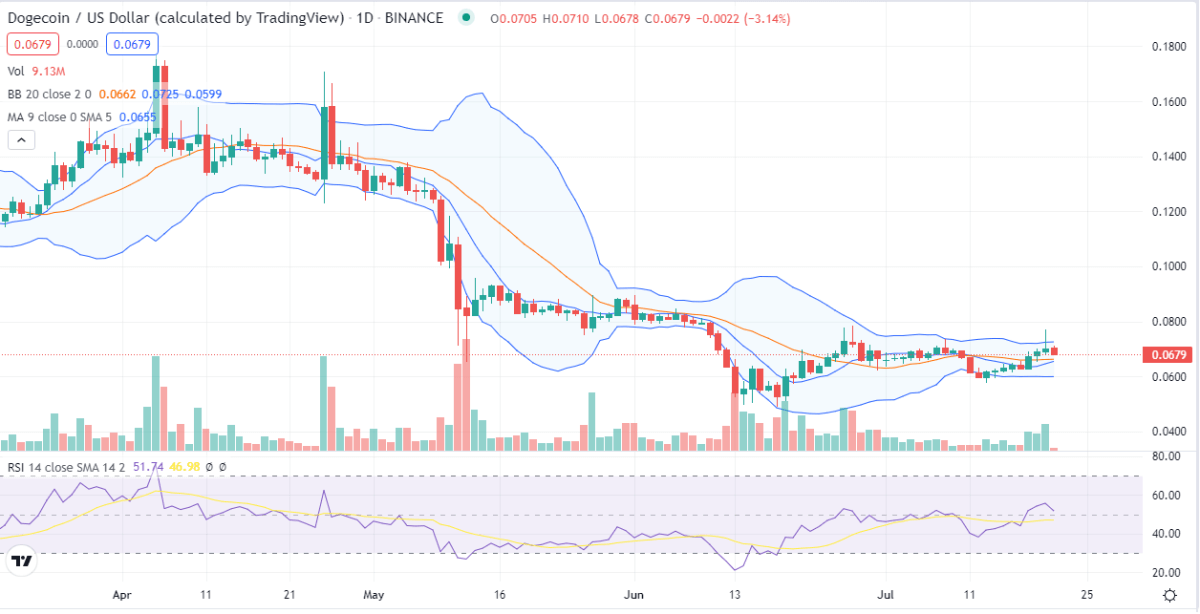
Dogecoin price analysis is bullish today as the coin trades above all the moving averages. The Relative Strength Index also finds itself in the overbought region. Dogecoin bulls found support at $0.0500, now a major resistance level for DOGE/USD. Dogecoin’s price is currently trading at $0.0679 and may retrace to the $0.0600 level before resuming its uptrend.
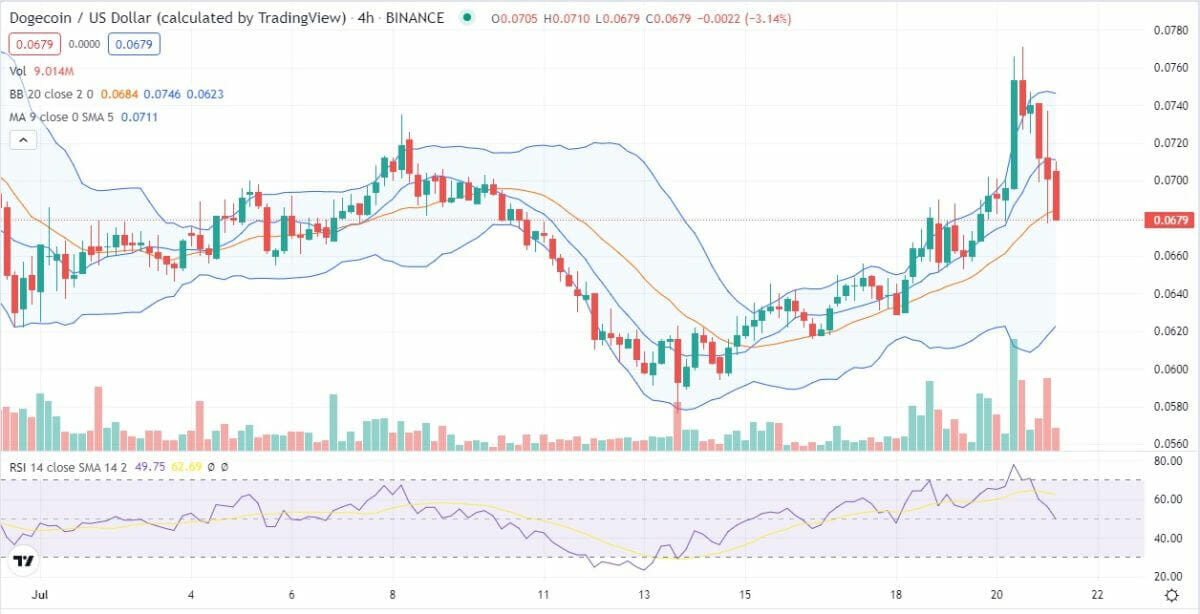
The Dogecoin price is trading above all the moving averages on the 4-hour chart, which is a bullish sign. The Relative Strength Index (RSI) has entered the overbought region, indicating that the bulls are in market control. A minor bearish divergence is forming between the RSI and the price as the RSI is making higher highs while the price is making lower highs. This divergence indicates that the upward momentum in the market may be slowing down.
Dogecoin price movement in the last 24 hours: Dogecoin trades sideways
The value of DOGE/USD fluctuated between $0.0655 and $0.06867 over the past 24 hours, with moderate volatility. Volume has increased by 21.22 percent, totaling $528.5 million, while the market cap is valued at around $9 billion, putting it in 10th place among all cryptocurrencies.

Source: TradingView
The Dogecoin price is currently trading at $0.0679 and is up by 5.06 percent over the last 24 hours. The coin has found support at the $0.0500 level, now a major resistance level. The next level of resistance lies at $0.0800, while support lies at $0.0600.
DOGE/USD 4-hour chart: Recent price developments
On the 4-hour chart, the Dogecoin price analysis has formed a bearish engulfing candlestick pattern, which is a reversal pattern. The DOGE/USD pair is trading below the 50-period moving average and may retrace to the $0.0600 level before resuming its uptrend.

Source: TradingView
The price of Dogecoin has been steadily rising over the last few days. From the $0.058 low reached previously, DOGE/USD rose to several higher highs until the $0.069 major resistance was breached as per Dogecoin price analysis.
This means that most of the loss incurred during the beginning of July has been reversed, and we may expect a return to the downside soon. However, no lower low has yet been formed, implying that we can expect further attempts to rally once a higher local low is established later in the week.
The MACD on the 4-hour Dogecoin price analysis chart is currently bullish territory as the MACD line (blue) is above the signal line. The RSI indicator finds itself in the overbought region, which indicates that the bulls are in control of market momentum. The Dogecoin price is currently trading at $0.0679 and may retrace to the $0.0600 level before resuming its uptrend.
Dogecoin price analysis: Conclusion
To summarise, the Dogecoin price is currently trading at $0.0679 and is down by 5.06 percent over the last 24 hours. The coin has found support at the $0.0500 level, now a major resistance level. The next level of resistance lies at $0.0800, while support lies at $0.0700.
Disclaimer. The information provided is not trading advice. Cryptopolitan.com holds no liability for any investments made based on the information provided on this page. We strongly recommend independent research and/or consultation with a qualified professional before making any investment decisions.


 Bitcoin
  Ethereum
  Tether
  USDC
USDC  TRON
TRON  Dogecoin
  Cardano
  Monero
  Bitcoin Cash
  Chainlink
  LEO Token
  Stellar
  Zcash
Zcash  Litecoin
  Hedera
  Dai
Dai  Cronos
  OKB
OKB  Tether Gold
  Ethereum Classic
  KuCoin
  Cosmos Hub
  Gate
Gate  Algorand
  VeChain
  Dash
Dash  Stacks
  Tezos
Tezos  TrueUSD
  IOTA
IOTA  Decred
  Theta Network
  Basic Attention
  NEO
NEO  Synthetix
  Qtum
Qtum  Ravencoin
  0x Protocol
  DigiByte
  Zilliqa
  Nano
Nano  Siacoin
  Numeraire
  Waves
Waves  Ontology
  Status
  Enjin Coin
  Hive
Hive  BUSD
BUSD  Pax Dollar
  Lisk
Lisk  Steem
Steem  Huobi
Huobi  OMG Network
  Bitcoin Gold
  NEM
NEM  Augur
Augur  Bitcoin Diamond