EOS Price Analysis: Will EOS Break out of the Horizontal Range?

- EOS price is trying to recover towards the upper price range of the consolidation phase over the daily chart.
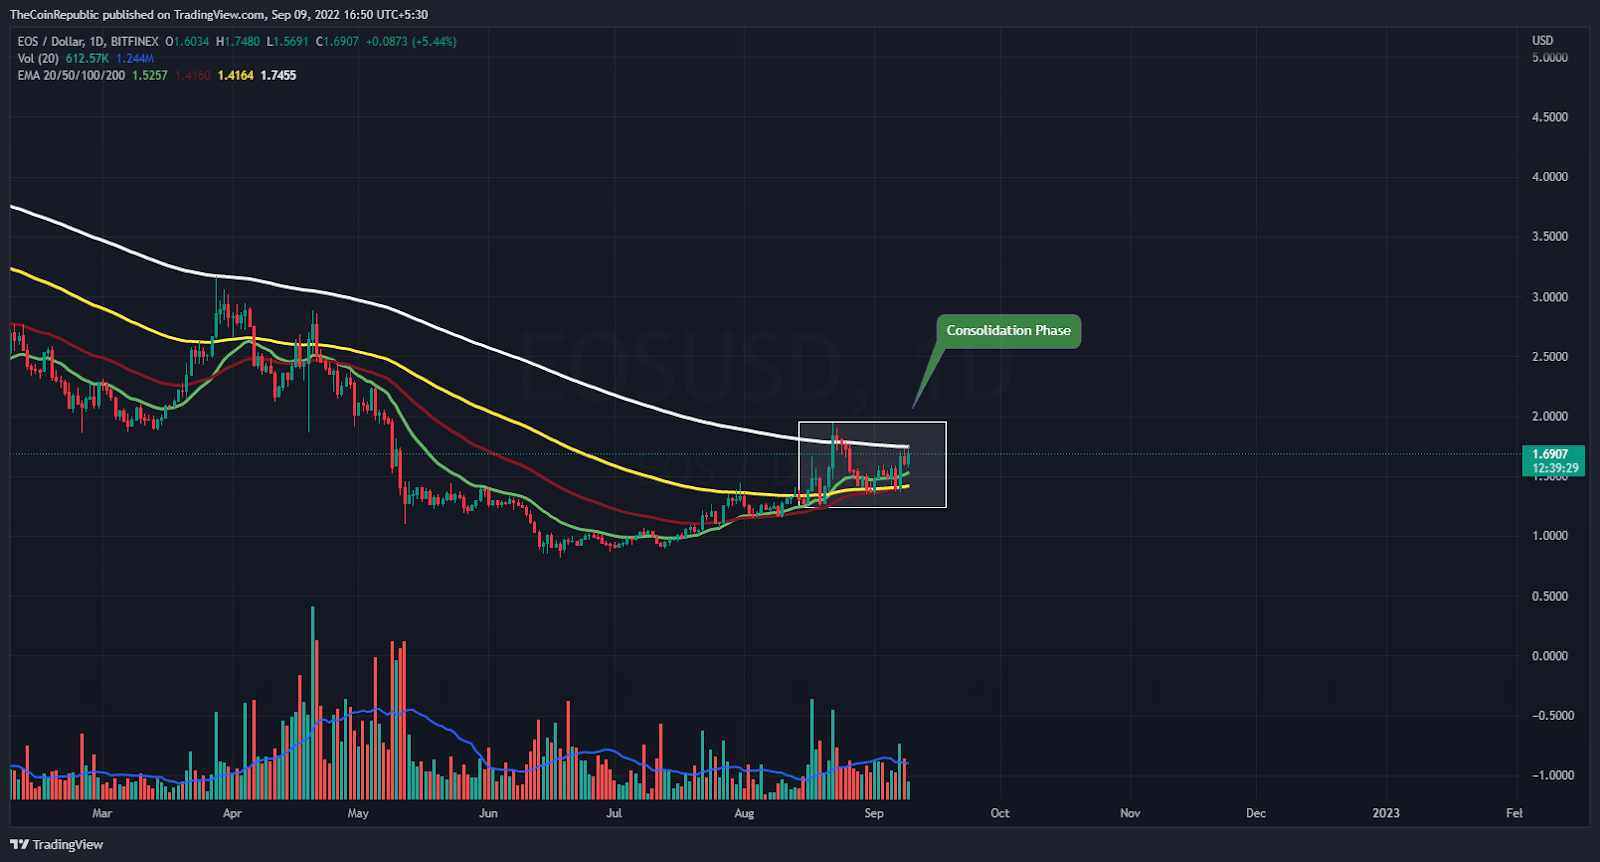
- EOS crypto is trading above 20, 50, and 100 DMA and is still below 200-day Daily Moving Average.
- The pair of EOS/BTC is at 0.00008058 BTC with an intraday drop of 4.31%.
The cost of the EOS has been locked inside a range-bound band ever since August 14th. This existential crisis led to panic selling on the cryptocurrency market. Despite the extreme volatility of the bitcoin market, investors are trying to hang onto their own holdings. EOS is one of the digital currencies experiencing an existential crisis as it teeters at a record low. During this turbulent moment, cryptocurrency investors need to be as rock-solid as those with diamond hands. Diamond hands won’t be as eager to sell their holdings as other players.
EOS is presently trading at $1.691, up 4.05% in market value from the day before. The volume of trades declined by 22.03% during intraday trading. This demonstrates that sellers are getting ready to short the EOS cryptocurrency market. The volume to market cap ratio is 0.3974.

Source: EOS/USD by TradingView
On the daily price chart, the price of the EOS coin is clearly declining. Due to the market’s ongoing drop, the cryptocurrency asset has reverted to the consolidation phase close to the 2020 lows. If the price of the EOS currency is to increase back to the upper price range of the consolidation period, more buyers must enter the market. The cost of EOS has been stable at $1.25 to $1.95. The volume movement, which is now minor in relation to the norm, must increase for EOS currency to cross the daily chart.
Will EOS Maintain this Bullish Momentum?

Source: EOS/USD by TradingView
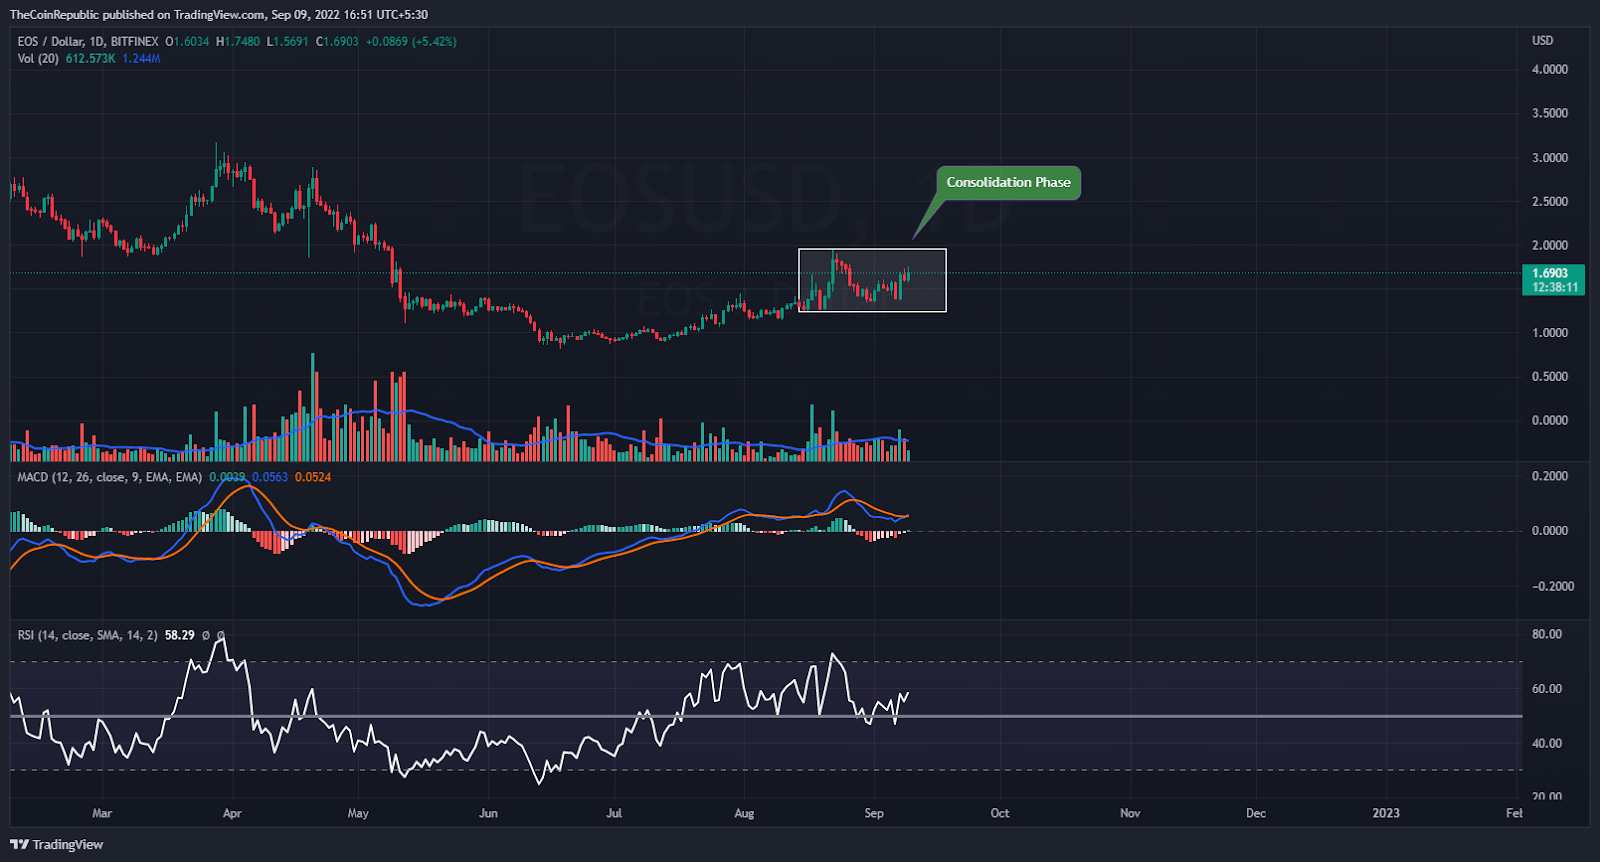
On the daily price chart, the price of EOS is rapidly declining. In order to quickly advance toward the top price range of the consolidation phase, the EOS currency has to attract support from buyers. The strength of the present upward trend for the EOS coin is demonstrated by technical indicators.
The relative strength indicator indicates that the price of the EOS currency is rising (RSI). At 58, the RSI is above neutrality. The EOS cryptocurrency’s MACD displays a bullish momentum. A positive crossover will occur when the MACD line crosses the signal line upward. Investors in EOS should monitor the daily chart for any shifts in trendss.
Conclusion
The cost of the EOS has been locked inside a range-bound band ever since August 14th. This existential crisis led to panic selling on the cryptocurrency market. Despite the extreme volatility of the bitcoin market, investors are trying to hang onto their own holdings. EOS is one of the digital currencies experiencing an existential crisis as it teeters at a record low. During this turbulent moment, cryptocurrency investors need to be as rock-solid as those with diamond hands. The cost of EOS has been stable at $1.25 to $1.95. The volume movement, which is now minor in relation to the norm, must increase for EOS currency to cross the daily chart. The strength of the present upward trend for the EOS coin is demonstrated by technical indicators. A positive crossover will occur when the MACD line crosses the signal line upward. Investors in EOS should monitor the daily chart for any shifts in trend.
Technical Levels
Support Level: $1.35 and $1.30
Resistance Level: $1.80 and $1.95
Disclaimer
The views and opinions stated by the author, or any people named in this article, are for informational ideas only, and they do not establish the financial, investment, or other advice. Investing in or trading crypto assets comes with a risk of financial loss.


 Bitcoin
  Ethereum
  Tether
  USDC
USDC  TRON
TRON  Dogecoin
  Cardano
  Bitcoin Cash
  Monero
  Chainlink
  LEO Token
  Stellar
  Zcash
Zcash  Litecoin
  Hedera
  Dai
Dai  Cronos
  Tether Gold
  OKB
OKB  Ethereum Classic
  KuCoin
  Cosmos Hub
  Gate
Gate  Algorand
  VeChain
  Stacks
  Tezos
Tezos  TrueUSD
  Dash
Dash  IOTA
IOTA  Theta Network
  Basic Attention
  NEO
NEO  Decred
  Synthetix
  Qtum
Qtum  Ravencoin
  0x Protocol
  DigiByte
  Zilliqa
  Nano
Nano  Siacoin
  Numeraire
  Waves
Waves  Status
  Ontology
  Enjin Coin
  BUSD
BUSD  Hive
Hive  Pax Dollar
  Lisk
Lisk  Steem
Steem  Huobi
Huobi  OMG Network
  Bitcoin Gold
  NEM
NEM  Augur
Augur  Bitcoin Diamond