LDO Price Analysis: Token Prices Gets Ready for a Big Move

- LDO token price has shown a strong consolidation at the demand zone after showing a strong breakout on the weekly time frame.
- The LDO token price is forming a symmetrical triangle pattern on a daily time frame.
- The pair of LDO/BTC is trading at the price level of $0.0000981 with an increase of $1.985 in the past 24 hours.
LDO token price is giving unclear signals as it trades above the demand zone. It has given a strong breakout of the supply zone but has failed to take off after the breakout. As of now LDO token price is trading at the price level of $2.681.
LDO Token Price Forms Continuation Pattern

Source: LDO/USDT by tradingview
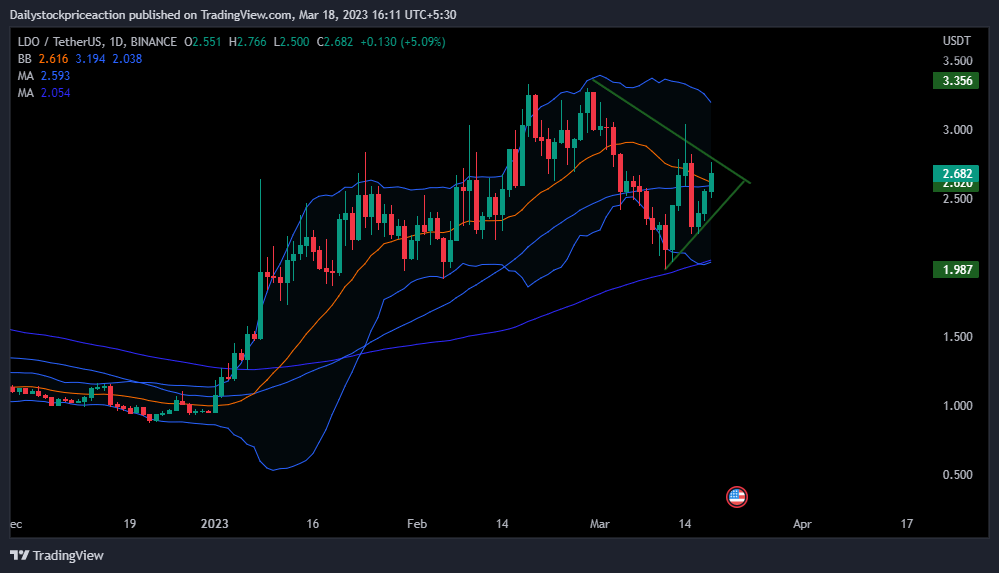
LDO token price, as per the price action, is forming a symmetrical triangle pattern. The token price is forming lower-low formation from the supply zone and higher-high formation further from the demand zone. At present, the token is trading in a narrow range and therefore breakout on either side will trigger big moves.
The token price can reach the $6.00 long-term supply zone if it breaks out of the small consolidation range on a daily time frame. On a larger time frame, the token price fell heavily and is making a lower low formation. To deny the continuation of the bearish trend on a higher time frame, the token price needs to break out of the symmetrical triangle pattern on the upside. LDO token price is trading in the middle of the Bollinger band indicator, after bouncing off the demand zone.
LDO token price is trading below all the important moving averages. The 50- and 100-day MAs can act as a strong supply zone in future as the token price tries to move up. Although the token price has given a breakout of 14 SMA, a breakout from the symmetrical triangle is essential for a move up. Volumes have been on the rise as the token hovers around the supply zone.
The LDO Token Price is Forming a Symmetrical Triangle Pattern on the Daily Time Frame

Source: LDO/USDT by tradingview
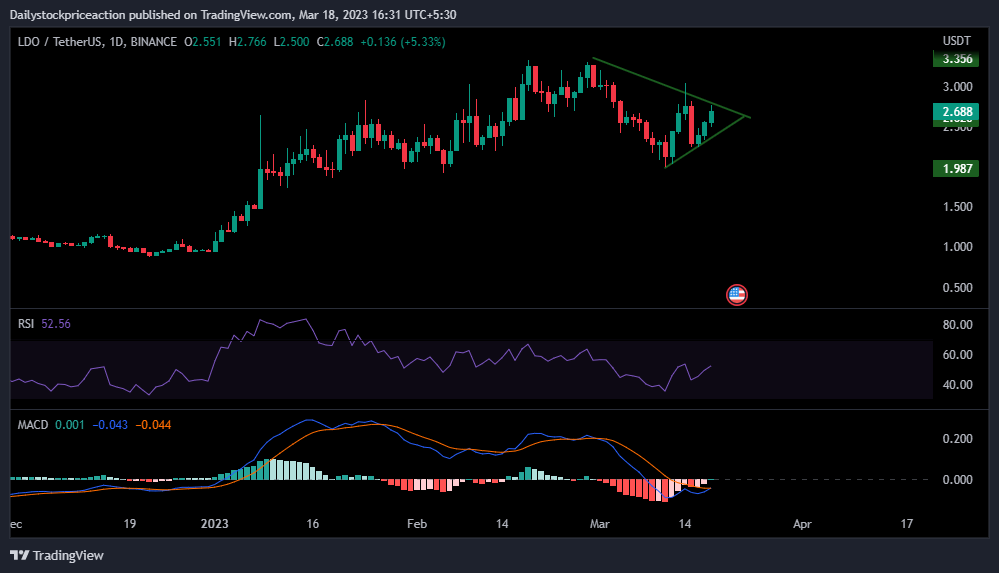
RSI curve is trading at 49.52 as the token nears the demand area. At present, the RSI curve has crossed the 20 SMA. The token is forming higher low and higher high formation on a 4-hour time frame as the token shows bullishness in the higher time frame. LDO token price can be seen moving up when it breaks out of the symmetrical triangle pattern and the RSI curve also moves higher.
The MACD indicator has given a negative crossover as the token price fell from an important supply zone. The blue line crossed the orange line on the downside. This has resulted in the token price moving down strongly in a 4-hour time frame. Recently, the LDO token price rose after the breakout of small support, as a result, the MACD indicator also depicted the same. Once the token price starts moving up again after breaking a small range, the gap between the blue and orange lines can be seen widening supporting the trend.
Conclusion: LDO token price is trading in a strong bearish trend as seen on the 4-hour time frame. While on the daily time frame the token price has been consolidating near the demand zone. The token price is forming a symmetrical triangle pattern on a daily time frame. Investors should wait for a breakout from a symmetrical triangle to consider actions.
Support: $2.01 and $1.9
Resistance: $2.8 and $3.2
Disclaimer
The views and opinions stated by the author, or any people named in this article, are for informational purposes only, and they do not establish financial, investment, or other advice. Investing in or trading crypto assets comes with a risk of financial los


 Bitcoin
  Ethereum
  Tether
  USDC
USDC  TRON
TRON  Dogecoin
  Cardano
  Monero
  Bitcoin Cash
  Chainlink
  LEO Token
  Stellar
  Zcash
Zcash  Litecoin
  Hedera
  Dai
Dai  Cronos
  OKB
OKB  Tether Gold
  Ethereum Classic
  KuCoin
  Cosmos Hub
  Algorand
  Gate
Gate  VeChain
  Dash
Dash  Stacks
  Tezos
Tezos  TrueUSD
  IOTA
IOTA  Decred
  Theta Network
  Basic Attention
  NEO
NEO  Synthetix
  Qtum
Qtum  Ravencoin
  0x Protocol
  DigiByte
  Zilliqa
  Nano
Nano  Siacoin
  Holo
Holo  Numeraire
  Waves
Waves  Ontology
  Status
  Enjin Coin
  Hive
Hive  BUSD
BUSD  Pax Dollar
  Lisk
Lisk  Steem
Steem  Huobi
Huobi  OMG Network
  Bitcoin Gold
  NEM
NEM  Augur
Augur