Luna Classic, Helium, Gnosis, Kusama and EOS – Biggest Weekly Losers

Be[in]Crypto takes a look at the five cryptocurrencies that decreased the most last week, more specifically, from Sept. 9 to Sept. 16.
These cryptocurrencies are:
- Terra Classic (LUNC): -47.56%
- Helium (HNT): -16.58%
- Gnosis (GNO): -16.21%
- Kusama (KSM): -15.66%
- EOS: -15.46%
LUNC
LUNC has been decreasing since reaching a high of $0.00059 on Sept. 8. The high was made at a confluence of important Fib levels, created by the 4.2-4.618 extension of the original upward movement (red) and the 1.61 length of waves one and three (white).
The ensuing downward movement has led to a low of $0.00024 on Sept. 15, seemingly causing a breakdown from the $0.00028 support area (red icon).
Unless LUNC reclaims the $0.00028 area, it could continue falling towards $0.000165. The possibility of a decrease is also supported by the daily RSI, which has fallen below 50 (red icon).
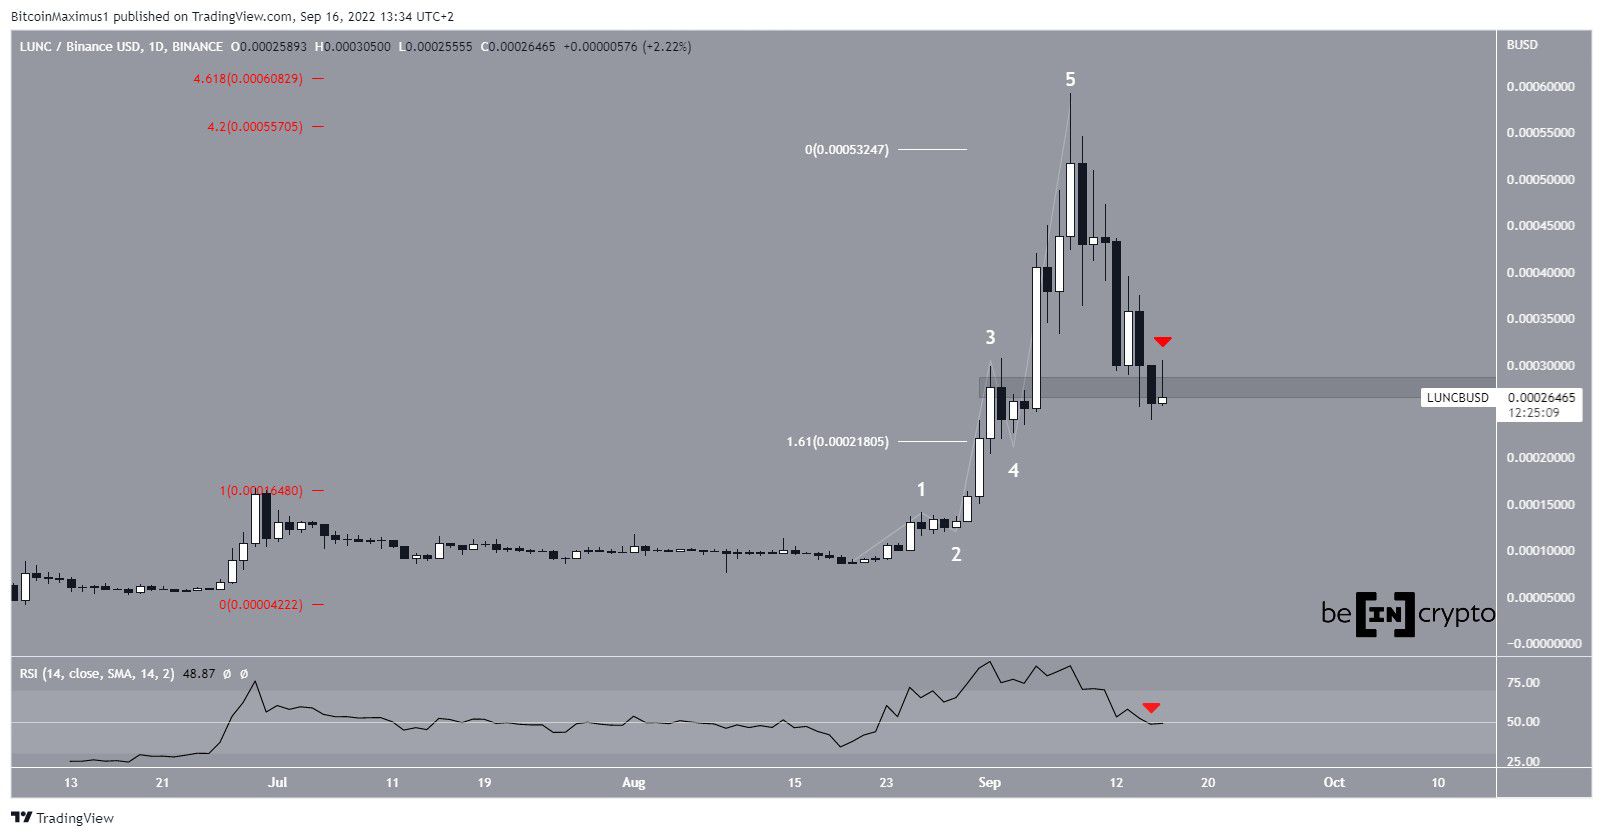
LUNC/BUSD Chart By TradingView
HNT
HNT has decreased since reaching an all-time high price of $51.47 in Nov. 2021. The downward movement has so far led to a low of $3.18 this month.
The ensuing bounce validated the $4 area as support (green icon), creating a bullish candlestick in the process. However, the upward movement could not be sustained, and the price has decreased to the $4 area again.
The weekly RSI is considerably below 50, indicating that the long-term trend is bearish. As a result, an eventual breakdown from the $4 area is likely. If one occurs, the next closest support area would be at $1.80
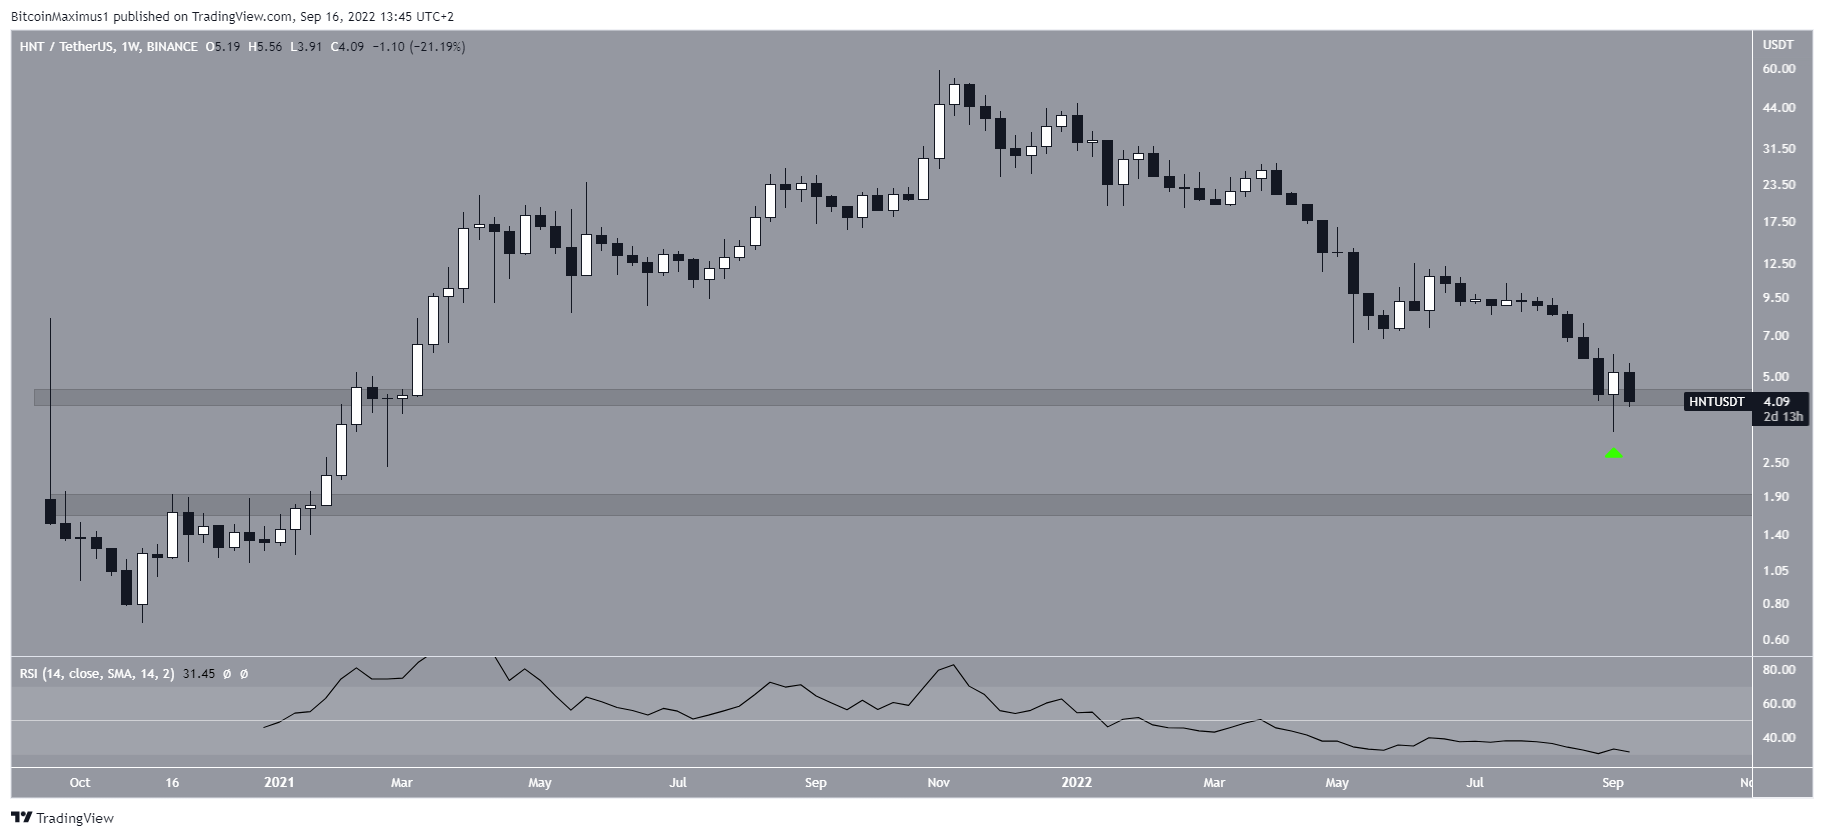
HNT/USDT Chart By TradingView
GNO
GNO has been decreasing since reaching a high of $205 on Aug. 18. The price created a lower high on Sept. 11 (red icon), validating the resistance line of a descending parallel channel.
If the downward movement continues, the closest support area would be at $125. The support is created by the support line of the channel and a horizontal support area.
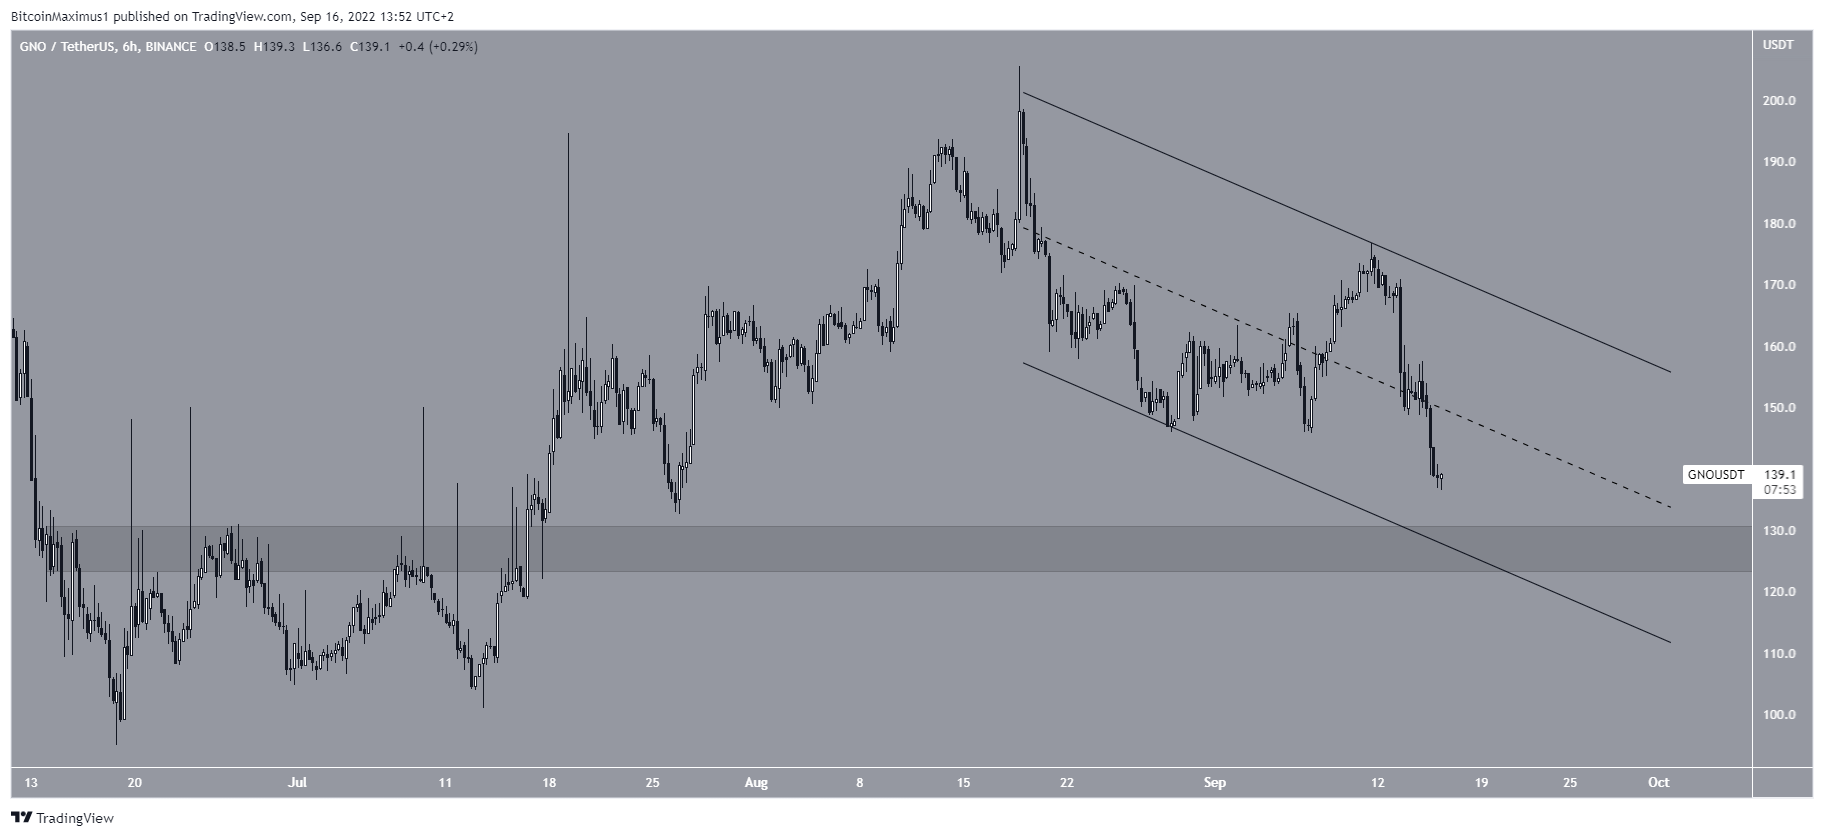
GNO/USDT Chart By TradingView
KSM
KSM has been falling since reaching a high of $69.91 on July 23. It created a slightly lower high in the beginning of Aug. before accelerating its rate of decrease.
On Thursday, KSM broke down from the $45 horizontal support area, which had been in place since June. On Friday, KSM reached a new yearly low of $42.85.
If the downward movement continues, the next closest support levels would be at $36 and $27, created by the 1.27 and 1.61 Fib retracement levels of the most recent upward movement.
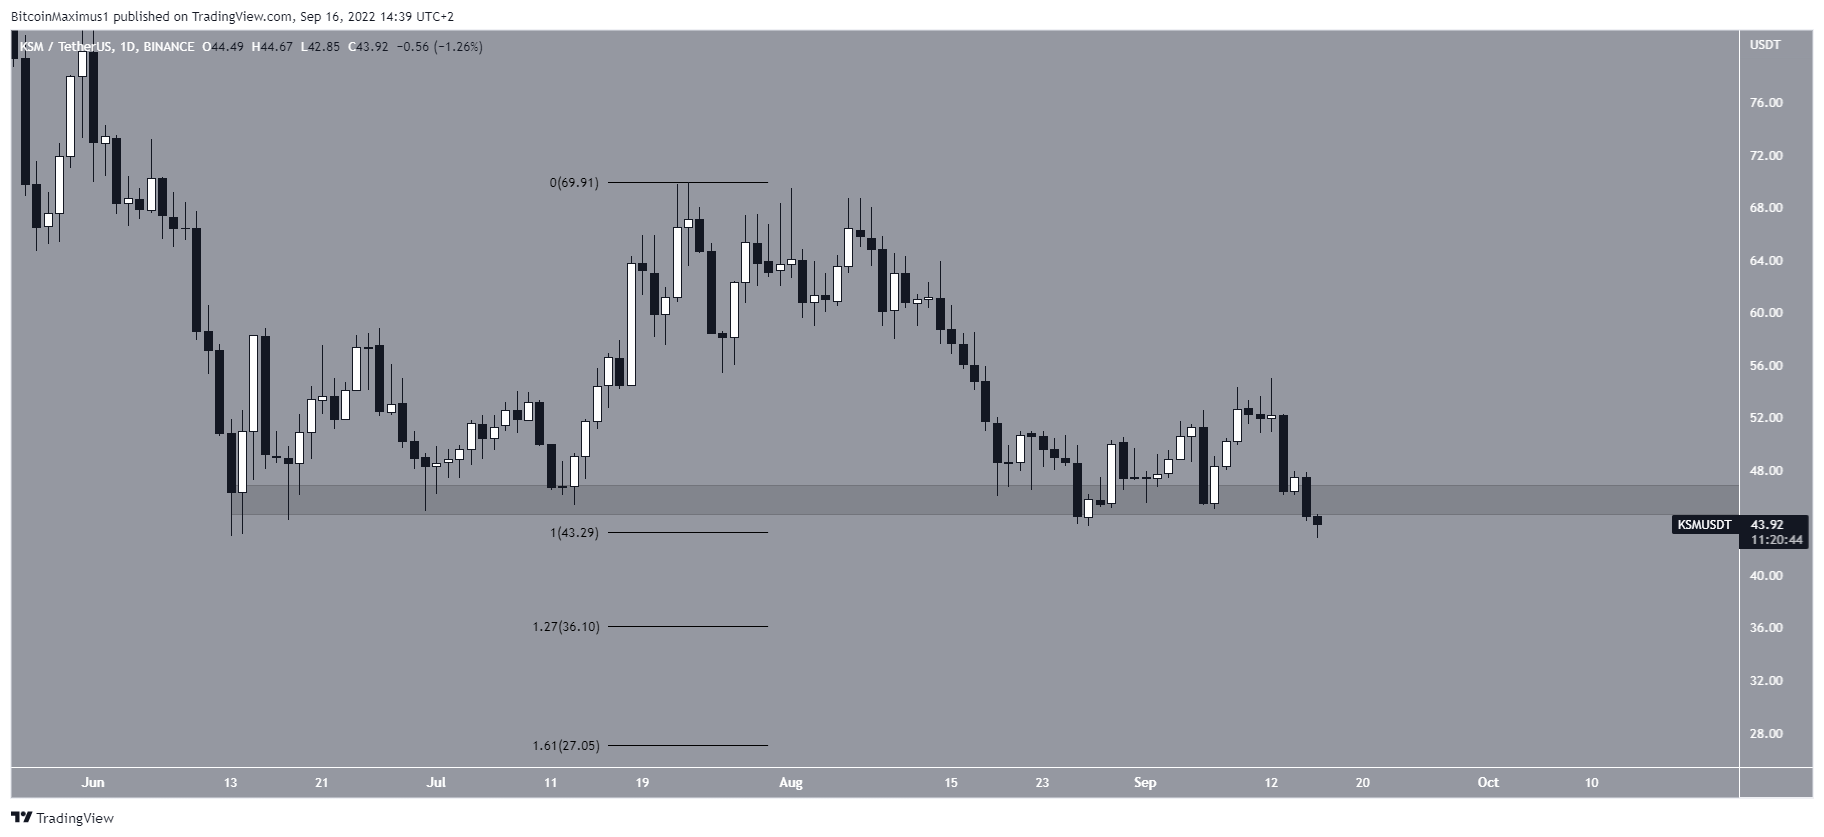
KSM/USDT Chart By TradingView
EOS
EOS has been falling since reaching a high of $1.90 on Aug. 23. The price created a lower high on Sept. 19 and accelerated its rate of decrease afterwards.
Currently, EOS is trading inside a confluence of support level at $1.40, created by a horizontal support area and the resistance line of a previous ascending parallel channel.
Whether EOS breaks down below this support area or bounces will likely determine the direction of the future trend.
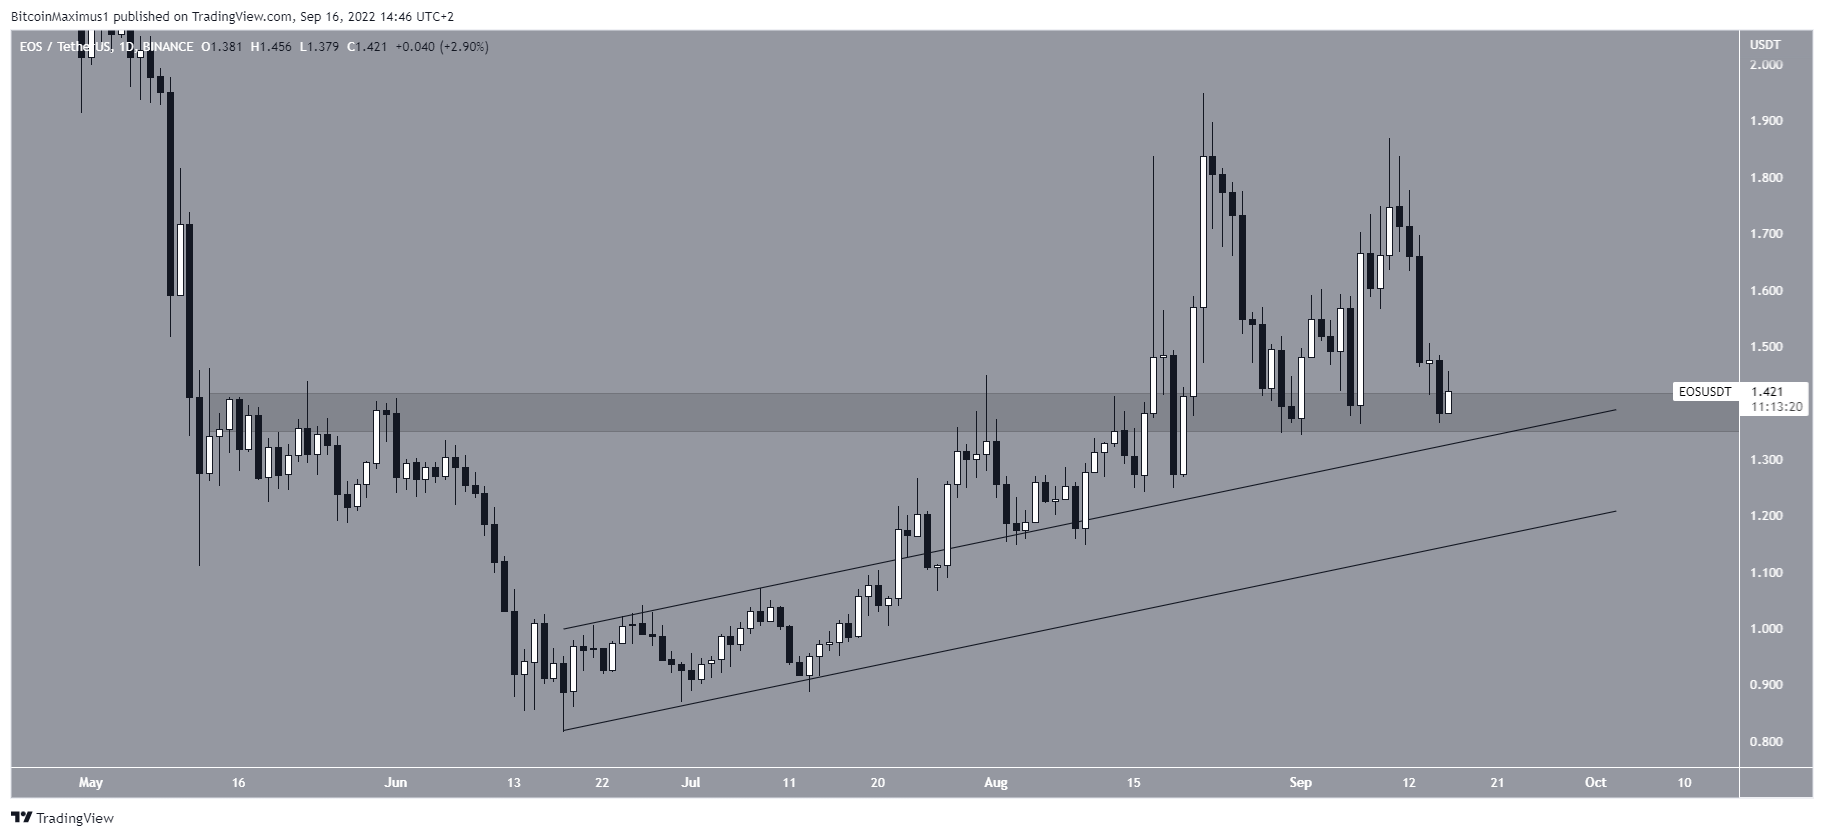
EOS/USDT Chart By TradingView
For Be[in]Crypto’s latest Bitcoin (BTC) analysis, click here


 Bitcoin
  Ethereum
  Tether
  USDC
USDC  TRON
TRON  Dogecoin
  Cardano
  Bitcoin Cash
  Chainlink
  LEO Token
  Zcash
Zcash  Monero
  Stellar
  Litecoin
  Hedera
  Dai
Dai  Cronos
  OKB
OKB  Tether Gold
  Ethereum Classic
  KuCoin
  Gate
Gate  Algorand
  Cosmos Hub
  VeChain
  Tezos
Tezos  Dash
Dash  Stacks
  TrueUSD
  IOTA
IOTA  Basic Attention
  Decred
  Theta Network
  NEO
NEO  Synthetix
  Qtum
Qtum  Ravencoin
  0x Protocol
  DigiByte
  Zilliqa
  Nano
Nano  Siacoin
  Numeraire
  Waves
Waves  Ontology
  Enjin Coin
  Status
  BUSD
BUSD  Hive
Hive  Pax Dollar
  Lisk
Lisk  Steem
Steem  Huobi
Huobi  OMG Network
  NEM
NEM  Bitcoin Gold
  Augur
Augur  Ren
Ren