


Top Analyst Says ‘All Eyes on Shiba Inu’ For an Impending Breakout

Shiba Inu recently formed a double bottom pattern on the weekly chart, signaling a looming trend reversal.
Shiba Inu has remained in consolidation in the past month despite the occasional gains registered by the broader crypto market. However, according to analysts who forecasted an impending breakout for the asset from its current cagey situation, this consolidation phase could be ending.
Crypto Rand, a prominent crypto investor and trader called attention to a pattern observed with Shiba Inu on the daily chart.
“Eyes on SHIB, it’s looking for the breakout!”
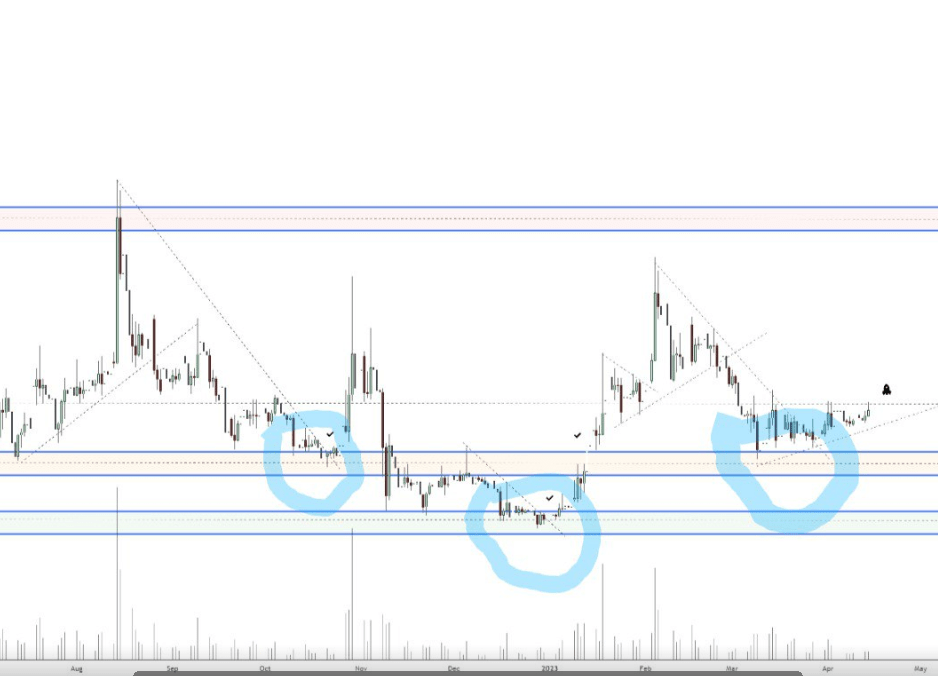
Image Source httpstwittercomcrypto randstatus1646812686619910146
The chart reveals a descending wedge SHIB has fallen into on several occasions. The chart shows that its price skyrockets each time SHIB hits the bottom of the descending wedge. This occurred in October 2022, resulting in a high of $0.00001488 before the FTX-induced decline the following month.
SHIB also hit the bottom of the wedge in December 2022, leading to another price rally which sent the asset to a high of $0.00001527 on Feb. 5 this year. The asset has once again reached the bottom of the wedge. Considering past performances, Crypto Rand is convinced it will again stage a rally.
Moreover, SHIB KNIGHT, a Shiba Inu community influencer and trader, pointed out a long-standing accumulation pattern observed with the asset around the $0.00001091 zone, forecasting an impending breakout.
$SHIB accumulating here for a long time. A breakout is likely to happen anytime ? pic.twitter.com/jIfSBrivIe
— $SHIB KNIGHT (@army_shiba) April 10, 2023
Additionally, on the weekly time frame, SHIB appears to have formed a double bottom pattern, with support around the $0.00000714 price level. A double bottom pattern occurs when an asset’s price falls to a certain level, bounces back up, falls again to the same level as the initial drop, and rises again.
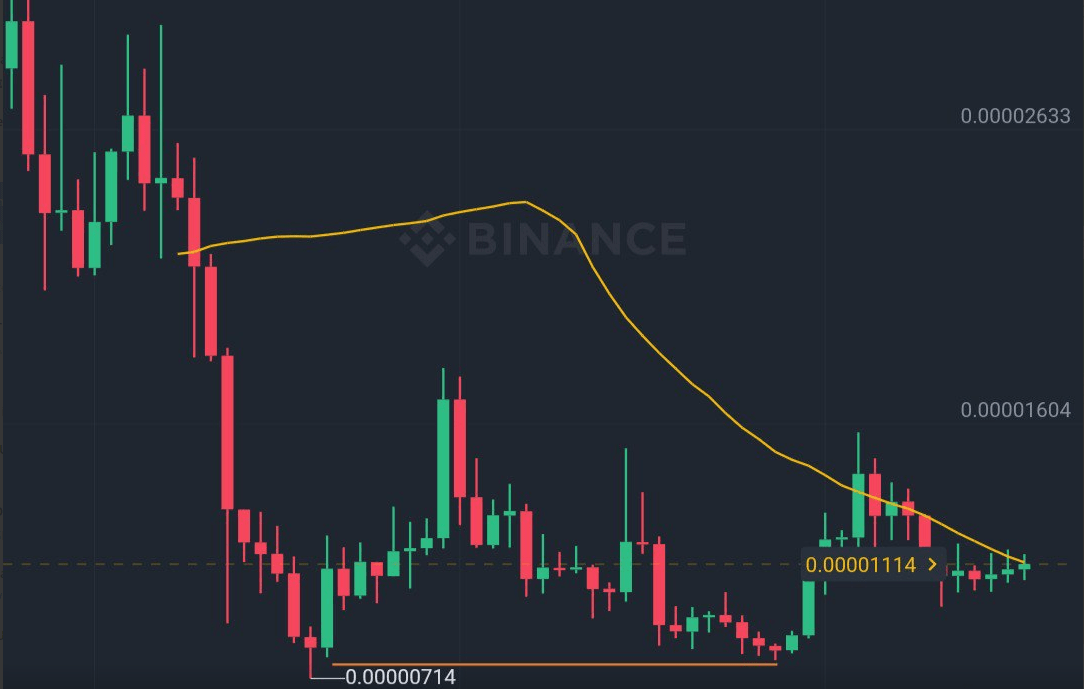
SHIB lokking to breakout
The double bottom pattern is considered bullish because it signals that the price has found support at a certain level twice, which suggests that buyers are willing to buy the asset at that price. If the price breaks above the neckline of the double bottom pattern, it is seen as a confirmation of the pattern and could suggest a breakout.
SHIB Remains a Favorite Among Whales
Despite the consolidation, Shiba Inu remains a favorite holding among whales on the Ethereum blockchain. A recent analysis of the top whales on Ethereum showed that Shiba Inu is the most traded token among these investors.
ANALYSIS OF THE TOP #WHALE WALLETS$SHIB $UNI $PROM $ETH $LYO $FTM $POLX $AVAX $USDC $USDT pic.twitter.com/CxqZdTLkEc
— PHOENIX ?? (@pnxgrp) April 10, 2023
Moreover, SHIB represents the single biggest holding by these deep-pocketed investors regarding its worth in the US dollar. Bullish sentiments remain prevalent amid the sustenance of social activity and token burns. In addition, most of the asset’s technicals are in bullish territories, per data from TradingView.


 Bitcoin
  Ethereum
  Tether
  USDC
USDC  Dogecoin
  Cardano
  Bitcoin Cash
  Polygon
  Litecoin
  LEO Token
  Hedera
  Cosmos Hub
  Stellar
  OKB
OKB  Maker
Maker  Algorand
  NEO
NEO  Gate
Gate  KuCoin
  Synthetix Network
  IOTA
IOTA  Tether Gold
  TrueUSD
  Enjin Coin
  0x Protocol
  Ravencoin
  Holo
Holo  Siacoin
  Zcash
Zcash  Basic Attention
  Decred
  Ontology
  Lisk
Lisk  Waves
Waves  DigiByte
  Numeraire
  Nano
Nano  Pax Dollar
  Status
  Steem
Steem  OMG Network
  BUSD
BUSD  Ren
Ren  Bytom
Bytom  Bitcoin Diamond
  Augur
Augur  HUSD
HUSD  Energi