Neo Price Analysis: When will NEO Skip Consolidating at 2020 Lows?

- Neo price has been consolidating at 2020 lows over the daily price chart.
- NEO crypto is trading above 20 EMA at 50 EMA and is still behind 100 and 200-days Daily Moving Average.
- The pair of NEO/BTC is at 0.0004472 BTC with an intraday drop of 4.99%.
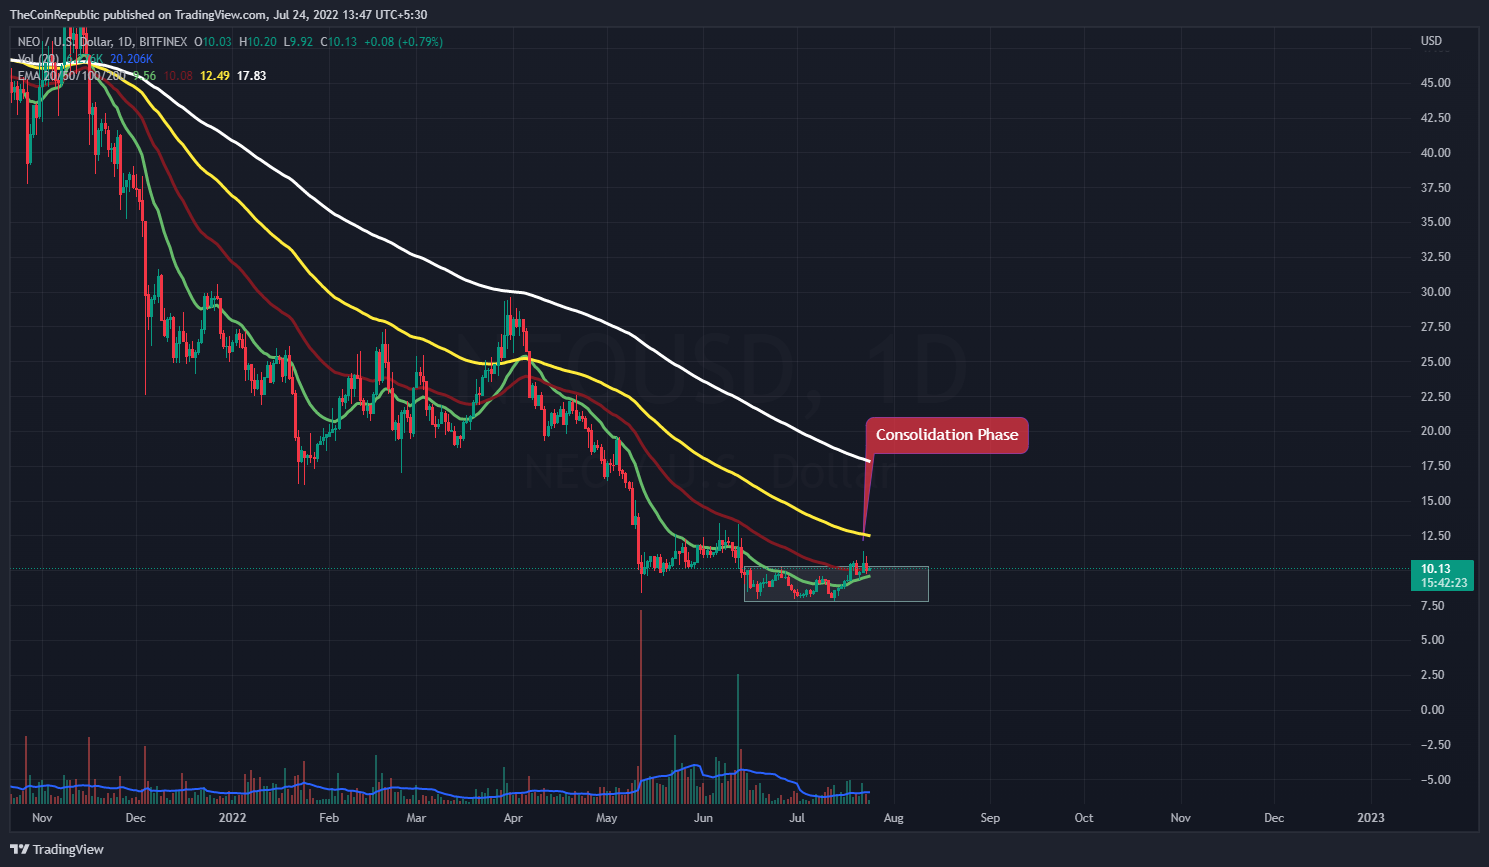
The NEO price is fighting to hang onto its place on the daily price chart. The token is working to keep up its momentum in an effort to hold its position. In order to maintain the momentum of the present increase and complete its breakout from the consolidation period, NEO currency must continue to attract buyers. The token needs to be held near the top of the horizontal range-bound area’s trendline. NEO bulls are stepping forward to help save the cryptocurrency. Trading volume, on the other hand, suggests that bears are attempting to drive NEO towards the lower trendline and pull the coin. NEO’s price has been stabilizing between $7.70 and $10.45. However, NEO coin is currently trying to sustain at the upper range and is trying to maintain itself to register its breakout from the consolidation phase.
The current estimated price of NEO is $10.13, and in the previous day, it lost 5.29 percent of its market capitalization. The intraday trading session saw a 36.61 percent decline in trade volume. This demonstrates that NEO is under pressure from short sellers on the chart. The market cap to volume ratio is 0.1026.

Source: NEO/USD by TradingView
The price of the NEO coin is attempting to climb toward the consolidation phase’s upper trendline. For the tokne to exit the horizontal range-bound region, more buyers are required. NEO bulls must gather themselves in order to allow the token to cross the daily price chart. However, the volume change is below average and must increase for NEO to become independent.
What do Technical Indicators suggest about NEO Crypto’s Escape?

Source: NEO/USD by TradingView
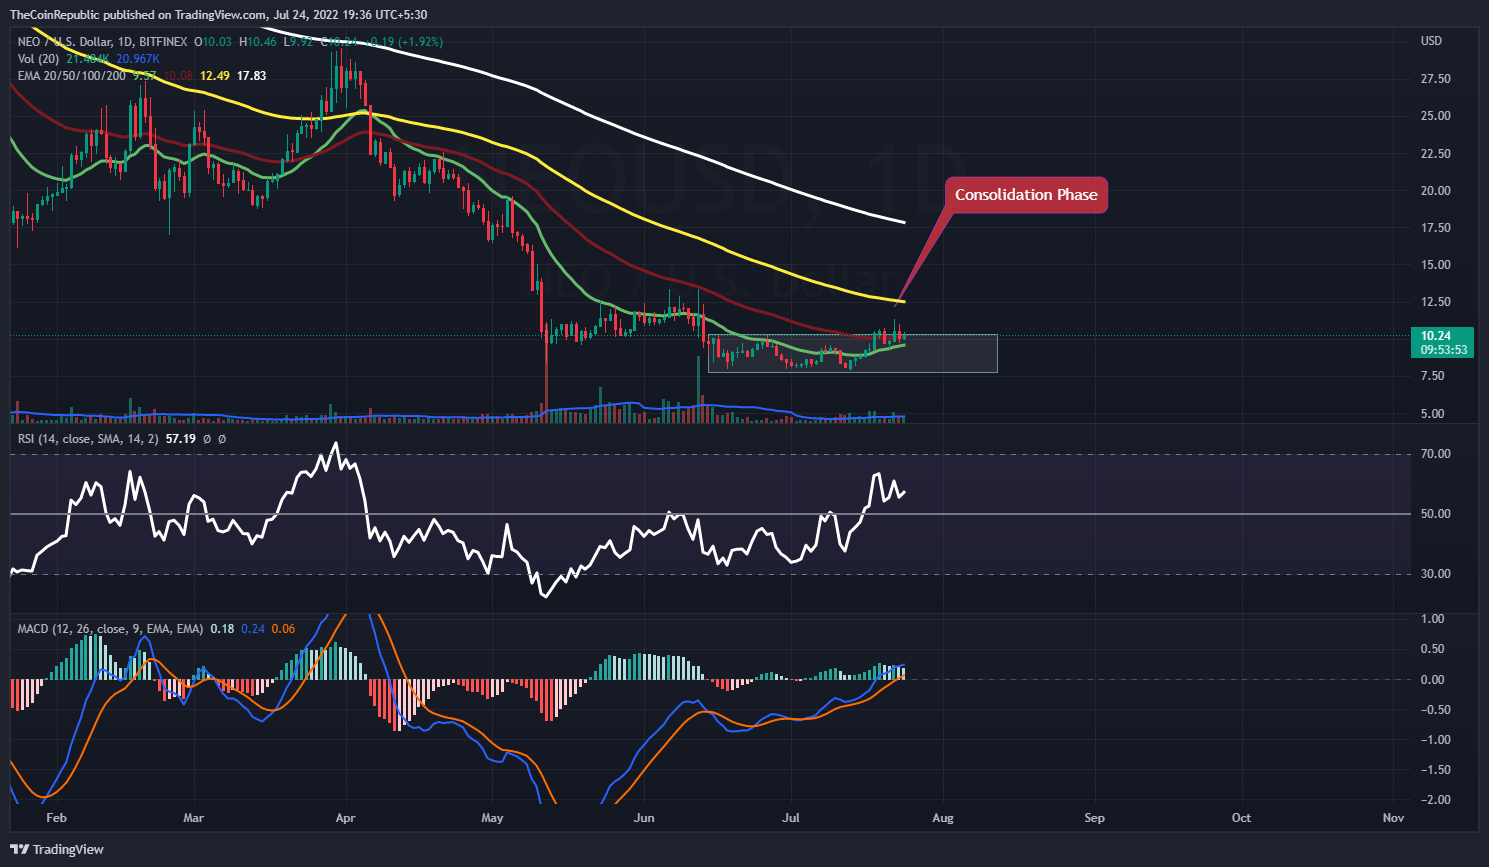
The NEO coin price had a chance to rise and restore the momentum of its advance on the daily price chart. The token needs to amass forces of buyers in order to maintain its position within the boundaries of the horizontal range. Technical indications point to the NEO coin’s downtrend trend momentum.
Relative Strength Index showcases the downtrend momentum of NEO near neutrality. RSI is at 55 and is preparing to break from neutrality towards the oversold territory. MACD exhibits the consolidation phase of NEO coin. The MACD line is ahead of the signal line and is approaching for a negative crossover. NEO investors need to wait for any directional change over the daily chart.
Conclusion
The NEO price is fighting to hang onto its place on the daily price chart. The token is working to keep up its momentum in an effort to hold its position. In order to maintain the momentum of the present increase and complete its breakout from the consolidation period, NEO currency must continue to attract buyers. The token needs to be held near the top of the horizontal range-bound area’s trendline. NEO bulls are stepping forward to help save the cryptocurrency. Trading volume, on the other hand, suggests that bears are attempting to drive NEO towards the lower trendline and pull the coin. NEO’s price has been stabilizing between $7.70 and $10.45. Technical indications point to the NEO coin’s downtrend trend momentum. The MACD line is ahead of the signal line and is approaching for a negative crossover. NEO investors need to wait for any directional change over the daily chart.
Technical Level
Support Level: $9.70 and $9.30
Resistance Level: $11.00 and $11.40
Disclaimer
The views and opinions stated by the author, or any people named in this article, are for informational ideas only, and they do not establish the financial, investment, or other advice. Investing in or trading crypto assets comes with a risk of financial loss.


 Bitcoin
  Ethereum
  Tether
  USDC
USDC  TRON
TRON  Dogecoin
  Cardano
  Monero
  Bitcoin Cash
  Chainlink
  LEO Token
  Stellar
  Zcash
Zcash  Litecoin
  Hedera
  Dai
Dai  Cronos
  OKB
OKB  Tether Gold
  Ethereum Classic
  KuCoin
  Cosmos Hub
  Algorand
  Gate
Gate  VeChain
  Dash
Dash  Stacks
  Tezos
Tezos  TrueUSD
  IOTA
IOTA  Decred
  Theta Network
  Basic Attention
  NEO
NEO  Synthetix
  Qtum
Qtum  Ravencoin
  0x Protocol
  Zilliqa
  DigiByte
  Nano
Nano  Siacoin
  Holo
Holo  Numeraire
  Waves
Waves  Ontology
  Enjin Coin
  Status
  Hive
Hive  BUSD
BUSD  Pax Dollar
  Lisk
Lisk  Steem
Steem  Huobi
Huobi  OMG Network
  Bitcoin Gold
  NEM
NEM  Augur
Augur