OKB Technical Analysis: Uptrend Teases 50% Fibonacci Breakout

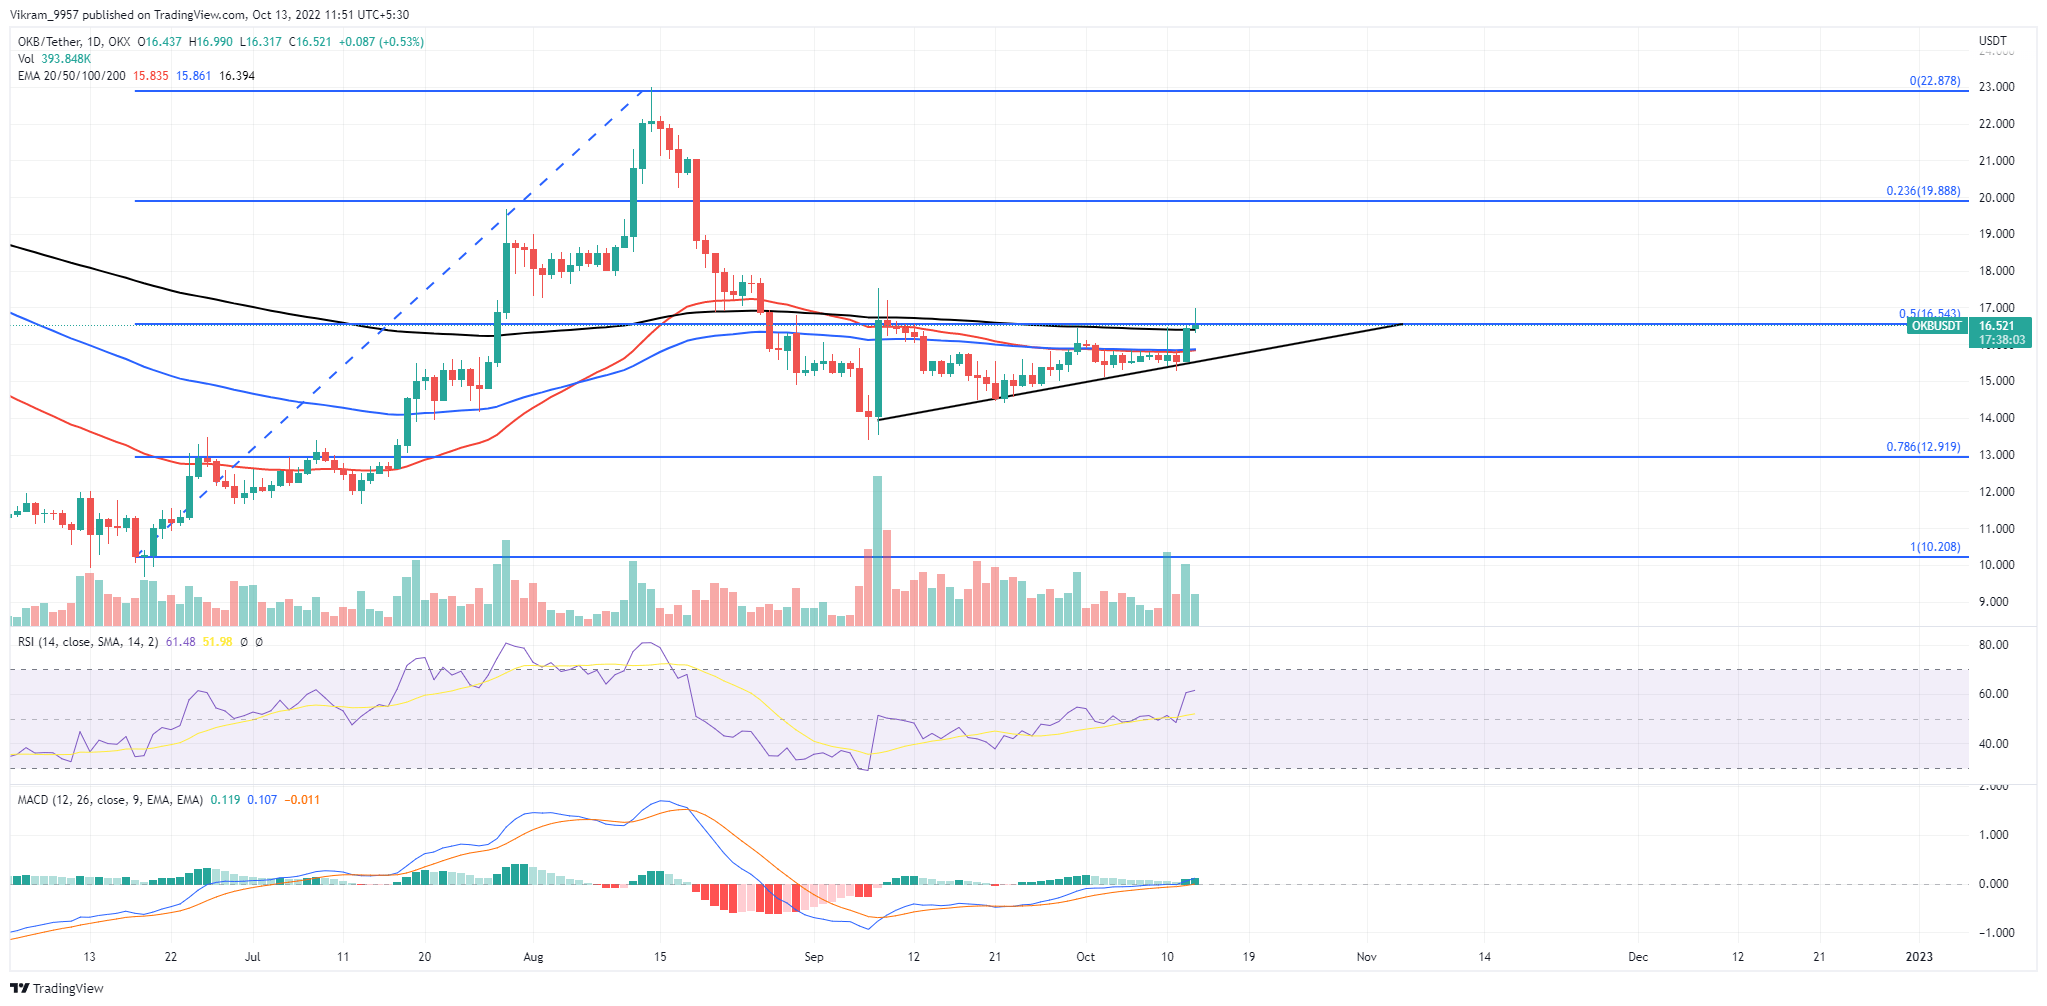
The OKB technical analysis offers a breakout entry opportunity if the buyers beat the overhead resistance of 50% Fibonacci level at $16.5. The OKB price action displays a rising trend within an ascending triangle pattern with an overhead resistance of $16.5. Furthermore, the resistance level coincides with the 50% Fibonacci level, which will signal a strong buying signal upon breakout. On the other hand, the higher price rejection in the daily candle warns of another bear cycle. Would you wait to buy at the support trendline?
Key Points:
- The 200-day EMA coincides with the $16.50 resistance level, increasing the bearish influence.
- A bullish breakout will launch the trapped momentum to reach the $20 mark.
- The intraday trading volume in Okex is $27.79 Million.

Source-Tradingview
OKB Technical Analysis
On 28 September, the OKB price action completed the morning Star pattern accounting for an 18.5% jump to challenge the overhead resistance confluence. The resistance confluence consisted of 200-day EMA, a $16.5 psychological mark, and the 50% Fibonacci level. However, the bullish attempt for a breakout rally failed, resulting in an ascending triangle pattern in the daily chart. The recent bull cycle on the 12th of October accounts for a 5.8% jump and challenges the bearish overhead ceiling. Additionally, the daily candle shows a bullish follow-through, but the higher price rejection warns of another bear cycle. So, if the buying pressure grows to undermine the higher price rejection, the daily candle closing above the $16.5 mark will signal a buying opportunity. The breakout rally will potentially launch the OKB market value to the 23.60% Fibonacci level close to $20, accounting for a 20% jump. On a contrary note, if the market sentiment turns bearish or starts a profit-booking phase, a bearish turnaround will test the rising support trendline. This will further prolong the resonance within the triangle.
Technical Indicator
The RSI indicator shows a spike above the halfway line and crosses above the 60% level, reflecting an improvement in the underlying sentiments. Moreover, the rising trend of MACD and signal lines increase the bullish gap with a boom in bullish histograms. Therefore, the OKB technical analysis offers a buying opportunity if the daily candle closes above the resistance confluence. Resistance levels- $16.5 and $19.88 Support levels- $15.5, $14.5


 Bitcoin
  Ethereum
  Tether
  USDC
USDC  TRON
TRON  Dogecoin
  Cardano
  Bitcoin Cash
  Chainlink
  Monero
  LEO Token
  Zcash
Zcash  Stellar
  Litecoin
  Hedera
  Dai
Dai  Cronos
  Tether Gold
  OKB
OKB  Ethereum Classic
  KuCoin
  Gate
Gate  Algorand
  Cosmos Hub
  VeChain
  TrueUSD
  Dash
Dash  Tezos
Tezos  Stacks
  IOTA
IOTA  Basic Attention
  Decred
  Theta Network
  NEO
NEO  Synthetix
  Qtum
Qtum  Ravencoin
  DigiByte
  0x Protocol
  Nano
Nano  Zilliqa
  Siacoin
  Numeraire
  Waves
Waves  Status
  BUSD
BUSD  Enjin Coin
  Pax Dollar
  Ontology
  Hive
Hive  Lisk
Lisk  Steem
Steem  Huobi
Huobi  NEM
NEM  OMG Network
  Bitcoin Gold
  Augur
Augur  Ren
Ren  HUSD
HUSD