Polkadot price analysis: DOT/USD consolidates near $6.67 amid bearish winds

Polkadot price analysis reveals that the DOT/USD pair is consolidating around $6.67 today after a slight pullback from yesterday’s high at $7.19. The bulls had earlier pushed the price up to this level following a period of sideways trading between $5.50 and $6.50. The Resistance for DOT/USD is set at $7.19 while support lies at the $6.64 level.

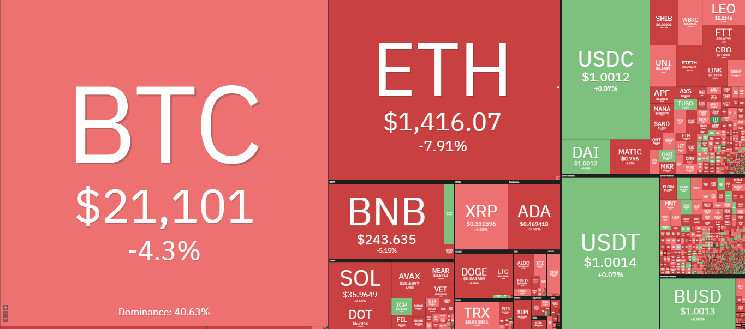
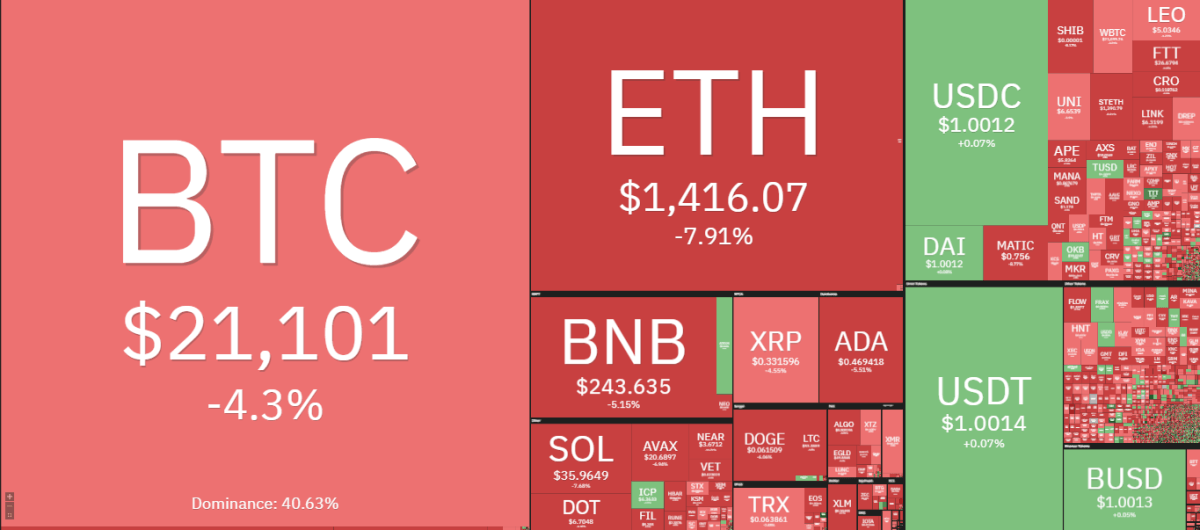
Cryptocurrencies price heat map, source: Coin360
The bulls had earlier attempted to push prices above the $7.19 resistance but were met with strong selling pressure that has resulted in the current consolidation. The price for DOT/USD has decreased by over 6.22 percent in the past 24 hours and is currently trading at the $6.67 mark.
Polkadot price analysis on a 1-day price chart: Bears adamant on pushing prices below the $6.67 level
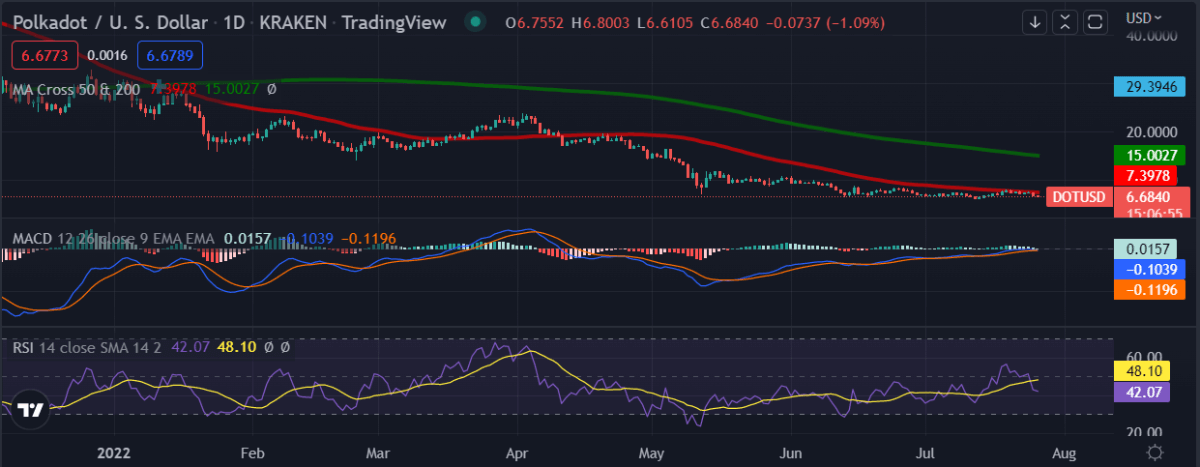
On the 1-day chart, Polkadot price analysis reveals that the price had earlier found support at around $6.64 as it attempted to make a comeback from the sell-off that saw prices tumble below the $6 level. The buyers have since pushed prices up to the current level where DOT/USD is trading at $6.67.

DOT/USD 1-day price chart, Source: TradingView
The 50-day moving average is presently providing support for the bulls as they attempt to push prices higher and the 200-day moving average is also trending above the current price level. The RSI indicator is presently at 47.48 and is slowly moving towards the overbought region, which could signal that the bulls are gaining strength. The moving average convergence divergence indicator is presently in the bearish zone but is slowly moving towards the bullish zone.
Polkadot price analysis on a 4-hour price chart: DOT/USD consolidates around $6.67
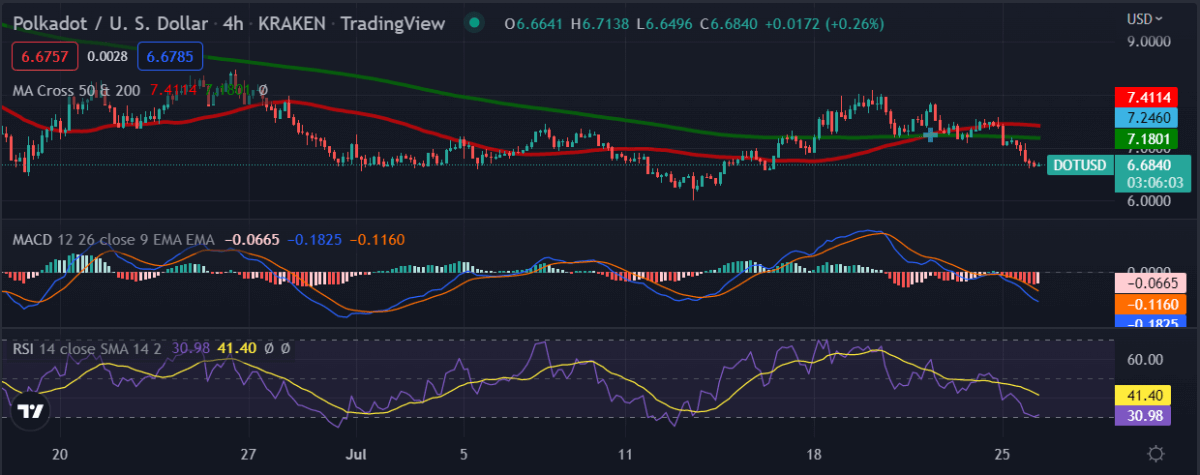
The 4-hour Polkadot price analysis reveals that the price action is trading within a descending triangle pattern. The bears gained control of the market following the breakdown of the ascending triangle pattern that had formed in the last few days. The price action has since been trading between the $6.64 and $7.19 levels which are the support and resistance levels respectively.

DOT/USD 4-hour price chart, Source: TradingView
The MACD indicator line (blue) is presently above the signal line but is slowly moving towards it which could signal that the sellers are losing momentum. The RSI indicator is presently below the 50 level which indicates that the market is presently in the bearish zone. The price action is presently trading below the 50-day moving average and the 200-day moving average which is both trending downwards.
Polkadot price analysis
In conclusion, Polkadot price analysis reveals that the bulls are struggling to push prices above the $7.19 resistance level as the bears maintain control of the market. DOT/USD is presently consolidating around $6.67 and a breakout from the descending triangle pattern could see prices move either upwards or downwards. A move below the $6.64 support level could see prices tumbling towards the $5 level while a move above the $7.19 resistance level could see prices rallying towards the $7.50 level.
Disclaimer. The information provided is not trading advice. Cryptopolitan.com holds no liability for any investments made based on the information provided on this page. We strongly recommend independent research and/or consultation with a qualified professional before making any investment decisions.


 Bitcoin
  Ethereum
  Tether
  USDC
USDC  TRON
TRON  Dogecoin
  Cardano
  Bitcoin Cash
  Zcash
Zcash  Chainlink
  LEO Token
  Monero
  Stellar
  Litecoin
  Hedera
  Dai
Dai  Cronos
  Tether Gold
  OKB
OKB  Ethereum Classic
  KuCoin
  Gate
Gate  Algorand
  Cosmos Hub
  VeChain
  Dash
Dash  Tezos
Tezos  TrueUSD
  Stacks
  IOTA
IOTA  Decred
  Basic Attention
  Theta Network
  NEO
NEO  Synthetix
  0x Protocol
  Qtum
Qtum  Ravencoin
  DigiByte
  Zilliqa
  Nano
Nano  Siacoin
  Numeraire
  Waves
Waves  Ontology
  Status
  BUSD
BUSD  Hive
Hive  Enjin Coin
  Pax Dollar
  Lisk
Lisk  Steem
Steem  Huobi
Huobi  OMG Network
  NEM
NEM  Bitcoin Gold
  Augur
Augur  Ren
Ren