QNT Technical Analysis: Will QNT Prices Reclaim $100 Value?

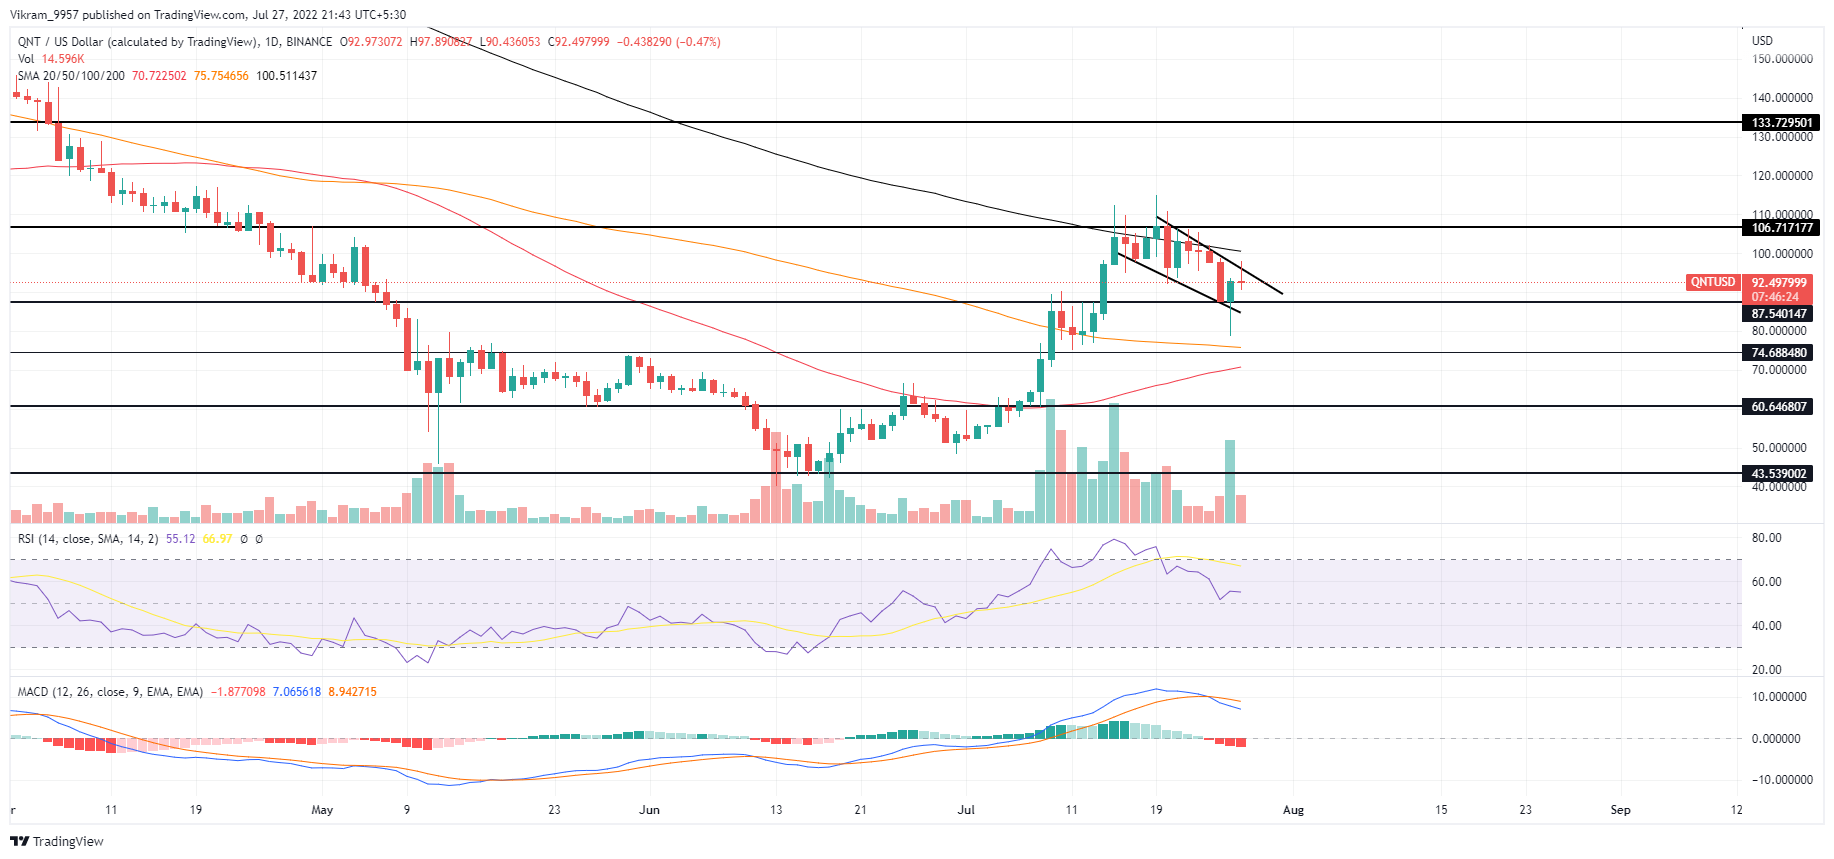
The QNT price action shows a post-retest reversal from the $85 mark, struggling to gain momentum within the falling channel. Key technical points:
- The QNT prices jumped by 1.90% in the last 24 hours.
- The bullish reversal retests the $85 mark.
- The 24-hour trading volume of Quant is $79.32 Million, indicating a drop of 17%.
Past Performance of QNT
As predicted in our previous article, the QNT prices grew 30% to jump from the 100-day SMA at $80 to the 200-day SMA at $105. However, the uptrend failed to beach the 200-day SMA resulting in a declining trend forming a falling channel. However, the price action makes a flag pattern, as the 30% jump acts as the flag pole.

Source- Tradingview
QNT Technical Analysis
The lower price rejection in the QNT daily candle teases a potential bullish reversal from the $85 mark with a morning star pattern. The bullish pattern breakout will discharge the constrained trend momentum and result in a high momentum uptrend. The 100-day SEMA is ready to assist the uptrend in case of a bearish pullback. Additionally, the increasing influence over the 50 and 100-day SMA teases a bullish crossover possibility. The bearish crossover of the MACD and signal lines opposes the possibility of a bullish turnaround. If, however, the MACD indicator regains the positive alignment, traders can expect the uptrend to create a new higher high above $100. In a nutshell, the technical indicators have an opposing view from the QNT price analysis, which supports the bullish reversal possibility.
Upcoming Trend
A potential bullish breakout of $100 will offer advantageous entry points for buyers that may increase the QNT price by 25% to the $133 mark. Conversely, the fallout of $85 will invalidate the bullish reversal possibility and trigger a decline to $75. Resistance Levels: $106 and $133 Support Levels: $87 and $75


 Bitcoin
  Ethereum
  Tether
  USDC
USDC  TRON
TRON  Dogecoin
  Cardano
  Bitcoin Cash
  Monero
  Chainlink
  LEO Token
  Stellar
  Zcash
Zcash  Litecoin
  Hedera
  Dai
Dai  Cronos
  Tether Gold
  OKB
OKB  Ethereum Classic
  KuCoin
  Cosmos Hub
  Gate
Gate  Algorand
  VeChain
  Stacks
  Tezos
Tezos  TrueUSD
  Dash
Dash  IOTA
IOTA  Theta Network
  Basic Attention
  Decred
  NEO
NEO  Synthetix
  Qtum
Qtum  Ravencoin
  0x Protocol
  Zilliqa
  DigiByte
  Nano
Nano  Holo
Holo  Siacoin
  Numeraire
  Waves
Waves  Ontology
  Status
  Enjin Coin
  BUSD
BUSD  Hive
Hive  Pax Dollar
  Lisk
Lisk  Steem
Steem  Huobi
Huobi  OMG Network
  NEM
NEM  Bitcoin Gold
  Augur
Augur  Bitcoin Diamond