Ripple Declines Marginally as It Faces Rejection at $0.39

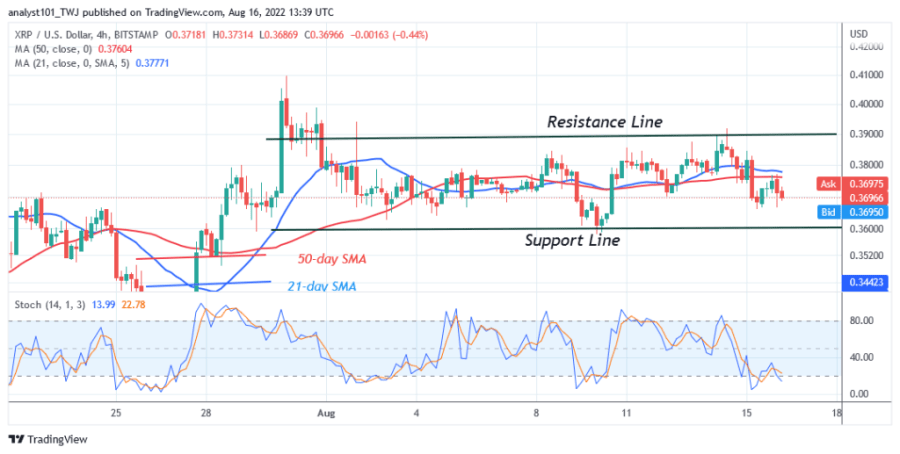
The price of Ripple (XRP) is trading in the uptrend zone as the altcoin drops below the 21-day line SMA. On August 14, buyers pushed XRP to the high of $0.39, but were rejected.
The wick of the candle indicates strong selling pressure at the $0.39 price level. XRP is trading between the moving average lines as it drops below the 21-day line SMA. The movement is insignificant due to the dominance of the doji candlesticks. If the price drops below the 50-day line SMA, XRP will return to the previous low of $0.30. However, if the 50-day line holds, the cryptocurrency will continue its movement between $0.36 and $0.39. Meanwhile, XRP/USD is trading at $0.37 at the time of writing.
Ripple indicator analysis
Ripple is at level 51 of the Relative Strength Index for period 14, with the XRP price bar between the moving average lines indicating further movement within the range. The altcoin is below the 40% area of the daily stochastic. The bearish momentum is unstable.

Technical Indicators
Key Resistance Zones: $0.40, $0.45, $0.50
Key Support Zones: $0.30, $0.25, $0.20
What is the next move for Ripple?
On the 4-hour chart, XRP/USD has declined and started a trading range between $0.36 and $0.39. The altcoin will develop when the range bound levels are broken. Meanwhile, when XRP recovers and resumes the uptrend, the indecisive candles with a small body will disappear. Nonetheless, the presence of an indecisive small-bodied candlestick will extend the range bound movement.

Disclaimer. This analysis and forecast are the personal opinions of the author and are not a recommendation to buy or sell cryptocurrency and should not be viewed as an endorsement by CoinIdol. Readers should do their own research before investing


 Bitcoin
  Ethereum
  Tether
  USDC
USDC  TRON
TRON  Dogecoin
  Cardano
  Monero
  Bitcoin Cash
  Chainlink
  LEO Token
  Stellar
  Zcash
Zcash  Litecoin
  Hedera
  Dai
Dai  Cronos
  OKB
OKB  Tether Gold
  Ethereum Classic
  KuCoin
  Cosmos Hub
  Gate
Gate  Algorand
  VeChain
  Dash
Dash  Stacks
  Tezos
Tezos  TrueUSD
  IOTA
IOTA  Decred
  Theta Network
  Basic Attention
  NEO
NEO  Synthetix
  Qtum
Qtum  Ravencoin
  0x Protocol
  DigiByte
  Zilliqa
  Nano
Nano  Siacoin
  Holo
Holo  Numeraire
  Waves
Waves  Ontology
  Status
  Enjin Coin
  BUSD
BUSD  Hive
Hive  Pax Dollar
  Lisk
Lisk  Steem
Steem  Huobi
Huobi  OMG Network
  Bitcoin Gold
  NEM
NEM  Augur
Augur  Bitcoin Diamond