ROSE Price Analysis: Will the ROSE Price Make a Bullish Breakout?

- The ROSE price is currently trading at $0.063 while seeing a change of 31.26% in 24-hour trading volume.
- The ROSE price has been observing an increase of 5.70% in the last 24 hours.
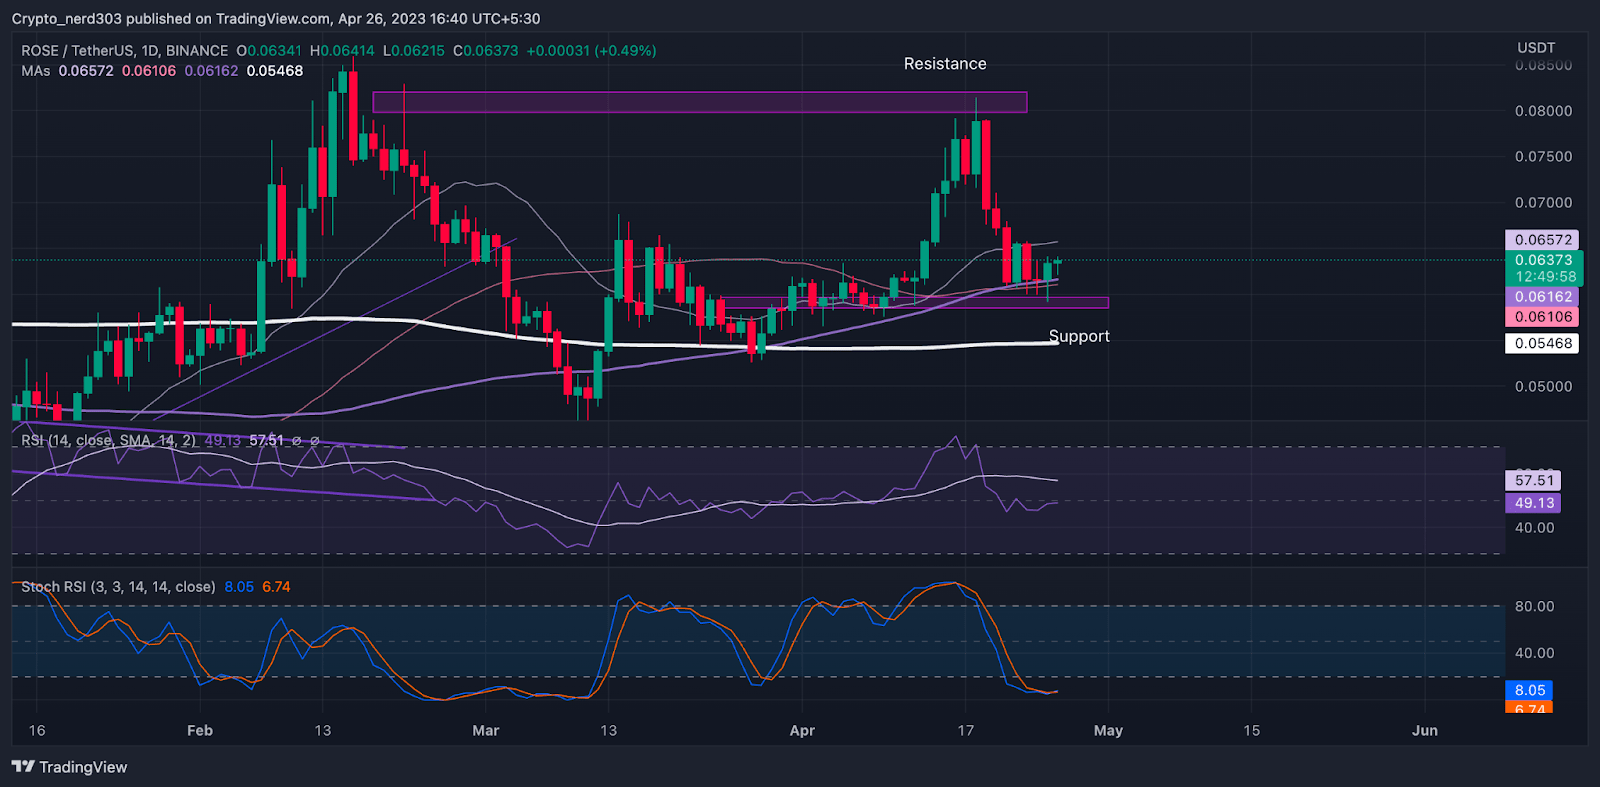
The sentiments of the investors are trading are taking a bullish turn. Recently, the ROSE price made a bullish breakout after breaking its consolidation pattern near $0.6000 where it gained 32% of its overall value. Though after taking resistance from its previous high the sellers took the market under their control. Presently the price is attempting to make another breakout.
The ROSE price will require fierce buyer support in order to attain its target. The price is also gaining support from major MA and EMA levels. Therefore the buyers may have a slight advantage over the majority of price action. Oscillators RSI and Stochastic are trading near their support levels. Where the statistic is below the 30 RSI points the RSI line is trading near the median line. The ROSE price is trading at $0.063 at present on the daily timeframe.
Rose price taking a bullish reversal from the 200-day EMA

Source: ROSE/USDT by TradingView
At present, the price is giving bullish indications. The next target level for ROSE is 25% above the current levels. This path also seems to offer the least resistance to ROSE which might interest buyers. Because all the major MAs and the EMAs are trading below the price, supporting it.
The oscillators are currently complementing each other. The RSI is trading near the demand zone giving a bullish indication. At present, the RSI line is trading near the median line. The current value of the RSI is 49.13 points, receiving resistance from the 14 SMA at 52.15 points.
The Stochastic RSI is in the bulls’ favor, trading near the overbought zone where the blue and red lines are giving a bearish interception. The %K line at 8.30 points is giving a bullish interception to the %D line at 6.84 points. The stochastic RSI is giving strong indications of making a bullish reversal, which will be observed in recent weeks.
Conclusion
As of now, the price is in the bears’ grip though that might change in the near future. The price is gaining support from both EMAs and MAs at the demand zone where the price is consolidating. The Stochastic RSI and RSI oscillators are trading near the oversold levels. If the price makes a strong bullish move at current levels it can make a bullish rally of 25%.
Technical levels –
Support -$0.05000 and $0.06000
Resistance – $0.07000 and $0.08000
Disclaimer
The views and opinions stated by the author, or any people named in this article, are for informational purposes only, and they do not establish financial, investment, or other advice. Investing in or trading crypto assets comes with a risk of financial loss.


 Bitcoin
  Ethereum
  Tether
  USDC
USDC  TRON
TRON  Dogecoin
  Cardano
  Bitcoin Cash
  Chainlink
  Monero
  LEO Token
  Stellar
  Zcash
Zcash  Litecoin
  Hedera
  Dai
Dai  Cronos
  Tether Gold
  OKB
OKB  Ethereum Classic
  KuCoin
  Gate
Gate  Algorand
  Cosmos Hub
  VeChain
  TrueUSD
  Tezos
Tezos  Dash
Dash  Stacks
  IOTA
IOTA  Basic Attention
  Theta Network
  Decred
  NEO
NEO  Synthetix
  Qtum
Qtum  Ravencoin
  DigiByte
  0x Protocol
  Nano
Nano  Zilliqa
  Siacoin
  Numeraire
  Waves
Waves  BUSD
BUSD  Status
  Pax Dollar
  Enjin Coin
  Ontology
  Hive
Hive  Lisk
Lisk  Steem
Steem  Huobi
Huobi  NEM
NEM  OMG Network
  Bitcoin Gold
  Augur
Augur  Ren
Ren  HUSD
HUSD