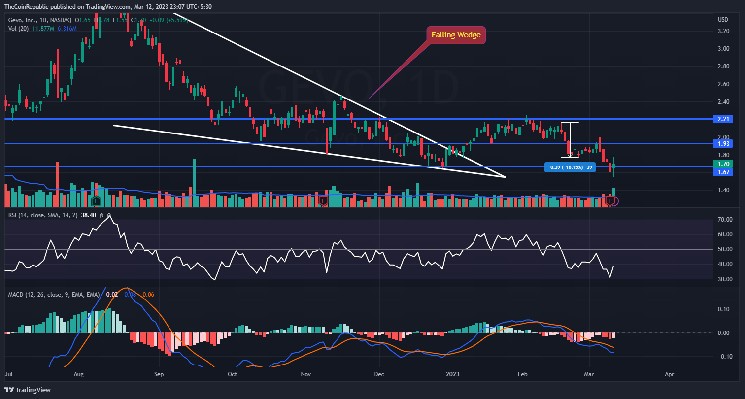
Solana price analysis: Bearish pressure pushes SOL price below $21.70

Solana price analysis for today shows that the price of SOL dropped below $21.70 as bearish pressure weighed in on the asset. The market is currently facing strong bearish pressure and has pushed the price to its lowest level for the past 24 hours.
SOL/USD currently has strong support at the $21.15 level, which is likely to hold for now. The next major support can be found around the $20 mark, and if that breaks down, then we could see further downside in SOL prices. On the other hand, resistance is present around the $23.07 mark, and breaking through it could signal a bullish trend in SOL price.
SOL/USD 1-day price chart: Bears determined to pull back price levels to former low
The 1-day Solana price analysis is indicating a downfall in the price today after the bears have successfully dodged the intensifying bullish momentum. The bears have taken the price down to $21.70 of value, and it is expected that further decline will be observed if the support at $21.15 is broken. The SOL has lost more than 2.72% of its value in the past 24 hours and is expected to decline even further. The RSI suggests that the price is currently oversold, so investors should wait for a pullback to enter the market.

SOL/USD 1-day price chart. Source: TradingView
The moving average (MA) is an important indicator, and in the 1-day price chart, it is present at $21.31, far below the current price value. Meanwhile, Bollinger’s bands are indicating a bearish trend with a strong deviation from the current price level. The upper Bollinger Band is present at $23.26, while the lower band is found at $17.56. Both of these bands indicate a bearish pressure on SOL, and if it continues, then we might see further downside in the price of this asset.
Solana price analysis: Price faces decline once again as bears cause disruption
The 4-hour Solana price analysis is going supportive for the bears, as seen from the latest price chart. The bears have restored their momentum after a slight gap happened in the past few hours. The past few days, bulls were seen to have control of the market, but with current bearish pressure, they have been able to regain their control and push SOL prices down.

SOL/USD 4-hour price chart. Source: TradingView
The moving average is present at $21.95, slightly above the current price level. The RSI is also going in favor of the bears and is currently residing near the oversold region of 48.68. The Bollinger Bands are still indicating a bearish trend with strong deviations from the current value suggesting more downside pressure ahead for SOL/USD. The upper band has reached the value of $23.51, and the lower band has reached $21.16.
Solana price analysis conclusion
The overall Solana price analysis shows that the bears are currently in control of the market, and unless there is a strong bullish momentum to break through the resistance at $23.07, then we can expect further downside for SOL prices. The technical indicators also support this bearish trend and suggest more losses ahead for this asset.
While waiting for Solana to move further, see our long-term price predictions on Cardano, Litecoin, and Waves.


 Bitcoin
  Ethereum
  Tether
  USDC
USDC  TRON
TRON  Dogecoin
  Cardano
  Bitcoin Cash
  Monero
  Chainlink
  LEO Token
  Stellar
  Zcash
Zcash  Litecoin
  Hedera
  Dai
Dai  Cronos
  OKB
OKB  Tether Gold
  Ethereum Classic
  KuCoin
  Cosmos Hub
  Gate
Gate  Algorand
  Dash
Dash  VeChain
  Stacks
  Tezos
Tezos  TrueUSD
  Decred
  IOTA
IOTA  Theta Network
  Basic Attention
  NEO
NEO  Synthetix
  Qtum
Qtum  0x Protocol
  Ravencoin
  Zilliqa
  DigiByte
  Nano
Nano  Holo
Holo  Siacoin
  Numeraire
  Waves
Waves  Ontology
  Enjin Coin
  Status
  BUSD
BUSD  Hive
Hive  Pax Dollar
  Lisk
Lisk  Steem
Steem  Huobi
Huobi  OMG Network
  Bitcoin Gold
  NEM
NEM  Augur
Augur