Solana price analysis: Bulls unable to uplift SOL above $40.5 as the price starts moving sideways

Today’s Solana price analysis reveals that the cryptocurrency price has slightly increased as bulls seem to be overcoming the bearish pressure as of now. A very small increment in price has been recorded, but SOL/USD price seems to be moving sideways today. The uptrend got stronger yesterday when the price increased notably, but today the price oscillation is slow, which is also evident from the relative strength index (RSI) curve, which is perfectly flat. The price is now at the $40.5 level, and the next resistance for the cryptocurrency is present at $41.9. The price movement is also slow because the price is trading near the resistance zone, and the coin has started to feel the pressure.
SOL/USD 1-day price chart: Bears can change the market position at any time
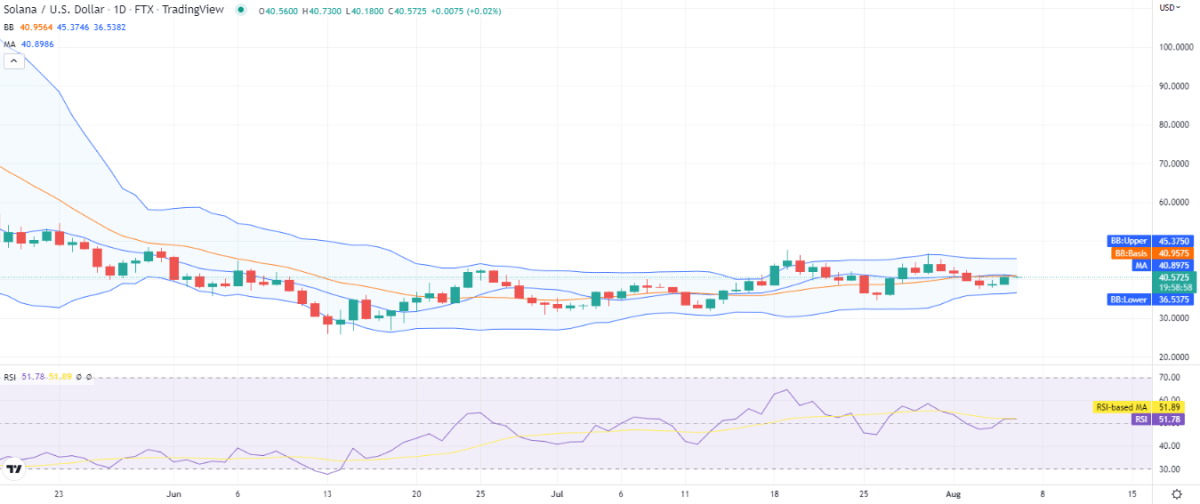
The one-day Solana price analysis is confirming sideways price action for the day with a slight increase in price seen. The price has constantly been turning to higher points since 04 August 2022, as the bulls have been trending. Today, a slight rise in price was observed as the price moved on to $40.5, gaining 1.50 percent value during the last 24 hours. On the other hand, the coin is at a loss of 3.10 percent for the past week as the trend was downwards at the start of the week. The moving average (MA) value is present at $40.8, just above the current price.

SOL/USD 1-day price chart. Source: TradingView
The SMA 20 curve is now lowered than the SMAb50 curve as a crossover was observed earlier, which is a bearish hint. The volatility is mild as the Bollinger bands have slightly converged 01 August 2022, and now the upper value of the Bollinger bands indicator is trading at $45, representing resistance, whereas their lower value is present at the $36 mark representing the support for SOL price function. The Relative Strength Index (RSI) curve is perfectly flat at index 51, hinting at a lack of momentum from either side of the market, which is why bulls are unable to uplift the price further.
Solana price analysis: Recent developments and further technical indications
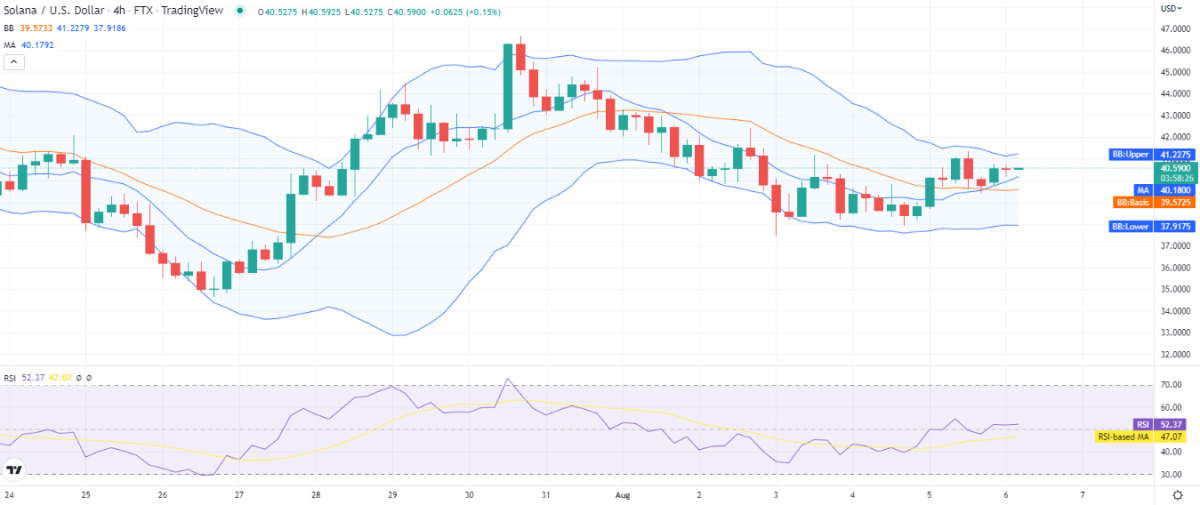
The 4-hour Solana price analysis shows the crypto pair price is following an uptrend on the four hours price chart as the price is recovering at the moment. Although the bulls were at lead earlier till yesterday, the starting four hours today have seen a loss in SOL value. The price is settling at $40.5 as it is yet unable to move to a higher position. The price is trending above the moving average value, which is present at $40.1.

SOL/USD 4-hours price chart. Source: TradingView
The volatility is not high, which means that the price might continue to slip sideways. The Bollinger bands average is forming at $39.5, where their upper value is at $41.2, representing resistance for SOL and the lower value is at the $37.9 mark representing the strongest support on an hourly basis. As the price is not yet moving in any direction, clearly, the RSI score is also stuck at index 52, which is still a neutral number.
Solana price analysis conclusion
The Solana price analysis is in favor of the bullish side as of now, but the trend can undergo a change in the coming hours today as the coin, after breaking downwards, managed to start recovery and is trading in greens at the moment. However, the bearish pressure is also there, and it can be expected that SOL/USD may undergo correction today.
Disclaimer. The information provided is not trading advice. Cryptopolitan.com holds no liability for any investments made based on the information provided on this page. We strongly recommend independent research and/or consultation with a qualified professional before making any investment decisions.


 Bitcoin
  Ethereum
  Tether
  USDC
USDC  TRON
TRON  Dogecoin
  Cardano
  Bitcoin Cash
  Chainlink
  Monero
  Stellar
  Zcash
Zcash  LEO Token
  Litecoin
  Hedera
  Dai
Dai  Cronos
  OKB
OKB  Tether Gold
  Ethereum Classic
  KuCoin
  Gate
Gate  Algorand
  Cosmos Hub
  VeChain
  TrueUSD
  Dash
Dash  Tezos
Tezos  Stacks
  IOTA
IOTA  Basic Attention
  Theta Network
  Decred
  NEO
NEO  Synthetix
  Qtum
Qtum  Ravencoin
  0x Protocol
  DigiByte
  Zilliqa
  Nano
Nano  Holo
Holo  Siacoin
  Numeraire
  Waves
Waves  BUSD
BUSD  Status
  Enjin Coin
  Ontology
  Pax Dollar
  Hive
Hive  Lisk
Lisk  Steem
Steem  Huobi
Huobi  OMG Network
  NEM
NEM  Bitcoin Gold
  Augur
Augur  Ren
Ren  HUSD
HUSD