Solana Price Analysis: SOL Needs to Shift Its Low above $30-Support Level

- Solana coin went down again and entered a low-high formation.
- SOL price is trading below the red moving lines of the EMA ribbon indicator.
- Trading volume fell 27% on the previous day to $708 million.
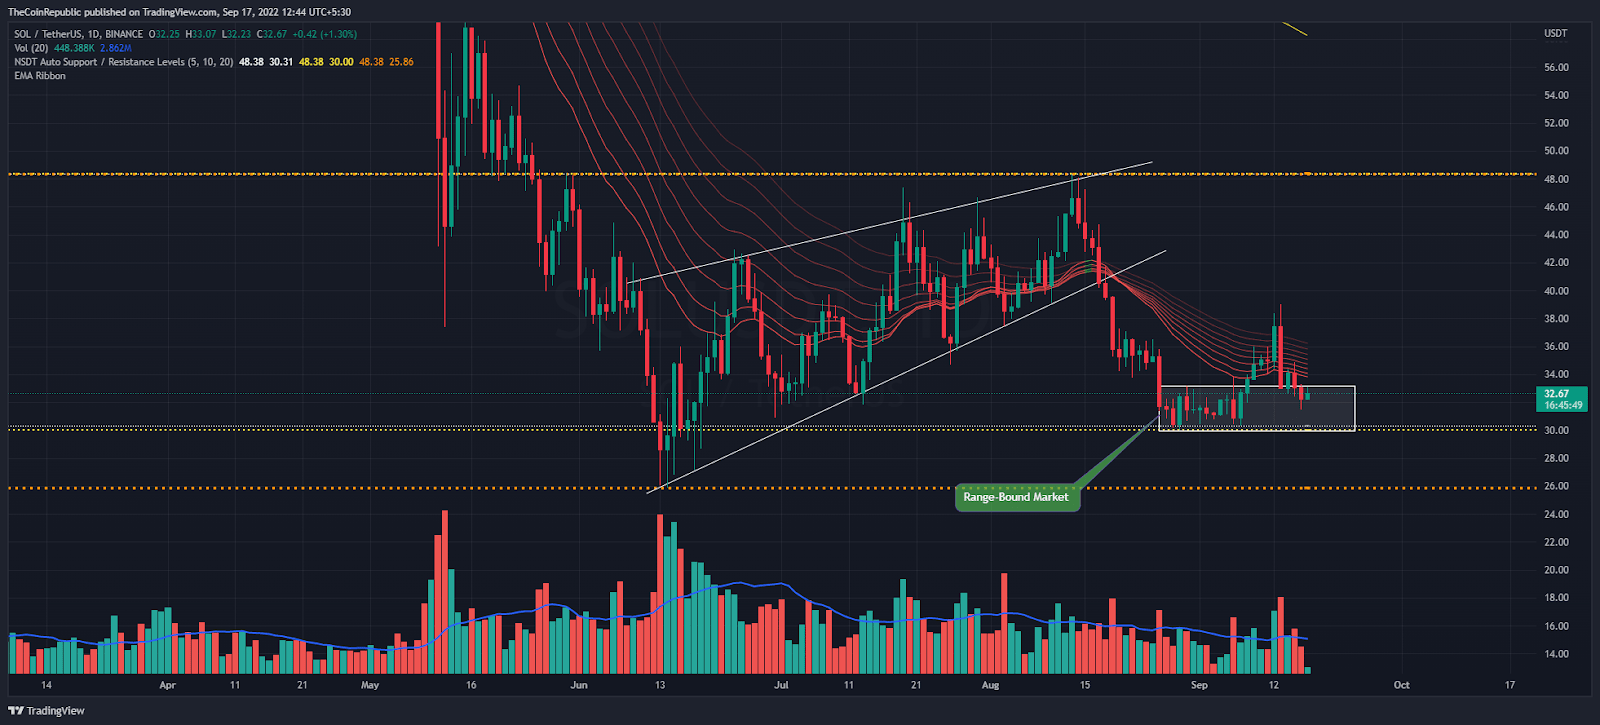
Solana Coin (SOL) has fallen in the last two trading sessions but the bulls try to manage the price in the green today. Buyers escaped the consolidation phase prior to the recent uptrend earlier this month. The SOL price is again under bear control this week, while the coin is down 6.74% so far this week.
The SOL coin price again entered a box pattern. After breaking the rising wedge pattern in the context of the daily price scale. Again buyers may struggle in this range, but this is a defensive zone for the bulls. Meanwhile, the SOL coin is trading at the $32.8 mark against the USDT pair as of press time.

Source: SOL/USDT by Tradingview
In addition to the short-term lower-high trend, sellers selling SOL coins are rising since their 52-week high of $259.9 mark. The $25 addition is a perfect example of what Mark has on the sapper level. Meanwhile, the market cap was recorded at $11.6 billion according to CMC, an 8% increase in the last 24 hours. Moreover, the SOL/BTC pair price is down 0.5% at 0.001653 Satoshis.
Since the weekly high, trading volume began to decline, reaching $700 million last night, down 21%. In terms of the daily price chart, SOL price is trading below the red moving lines of the EMA Ribbon Indicator.
RSI Reflects Positive Sign for SOL

Source: SOL/USDT by Tradingview
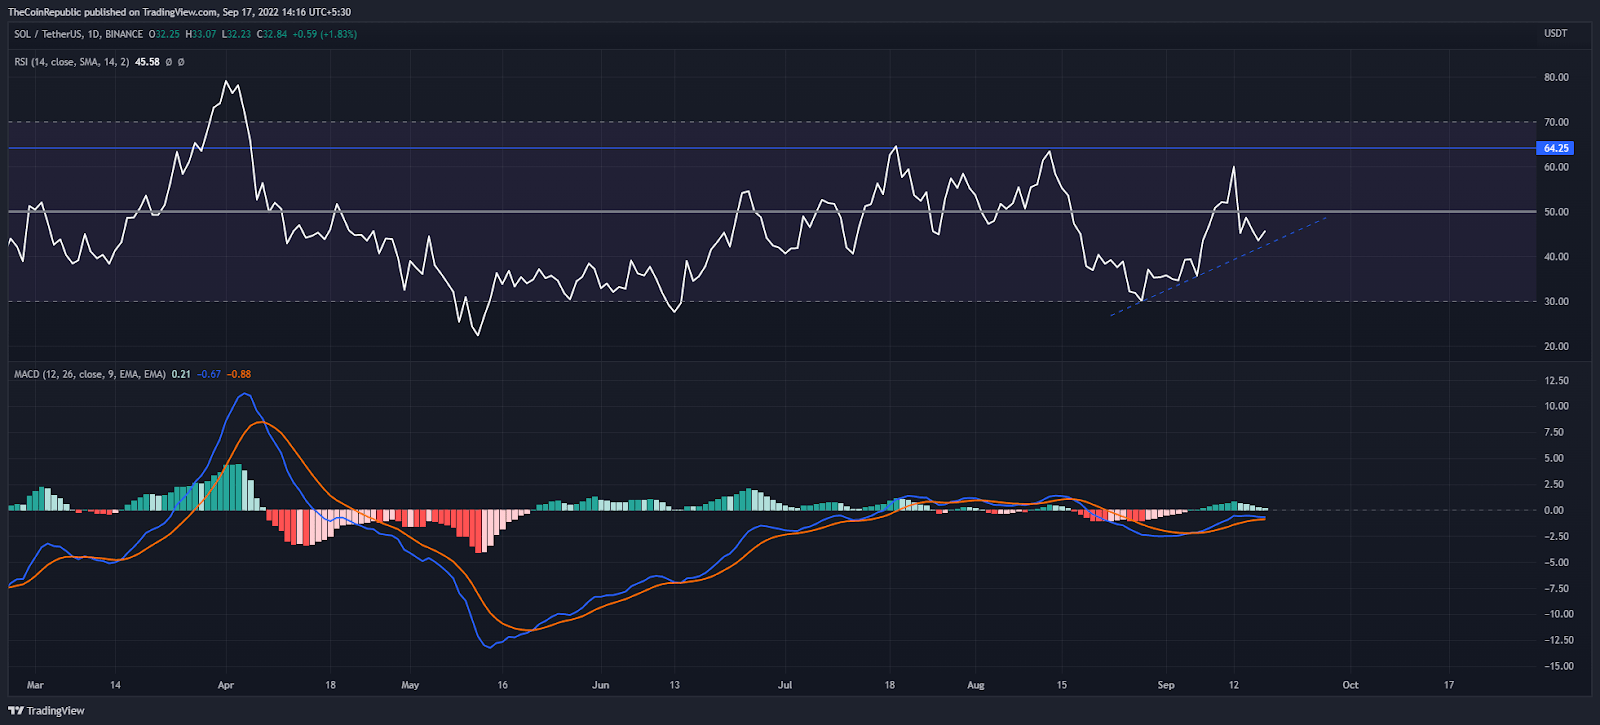
The RSI indicator is back to retest the bullish trendline in the context of the daily price scale. The RSI shows a downside for the RSL coin till the bottom of the half-line. Conversely, the MACD is close to moving above the neutral zone, but the histogram has started making lower highs.
Conclusion
Solana coin needs to avoid trading price above sideways box pattern. The RSI is slightly positive for SOL al as it remains above the bullish trend line on the daily time frame.
Support levels – $30 and $26
Resistance level – $40 and $50
Disclaimer
The views and opinions stated by the author, or any people named in this article, are for informational ideas only. They do not establish any financial, investment, or other advice. Investing in or trading crypto assets comes with a risk of financial loss


 Bitcoin
  Ethereum
  Tether
  USDC
USDC  TRON
TRON  Dogecoin
  Cardano
  Bitcoin Cash
  Monero
  Chainlink
  LEO Token
  Stellar
  Zcash
Zcash  Litecoin
  Hedera
  Dai
Dai  Cronos
  Tether Gold
  OKB
OKB  Ethereum Classic
  KuCoin
  Cosmos Hub
  Gate
Gate  Algorand
  VeChain
  Stacks
  Tezos
Tezos  TrueUSD
  Dash
Dash  IOTA
IOTA  Theta Network
  Basic Attention
  Decred
  NEO
NEO  Synthetix
  Qtum
Qtum  Ravencoin
  Zilliqa
  0x Protocol
  DigiByte
  Nano
Nano  Siacoin
  Numeraire
  Waves
Waves  Ontology
  Status
  Enjin Coin
  BUSD
BUSD  Hive
Hive  Pax Dollar
  Lisk
Lisk  Steem
Steem  Huobi
Huobi  OMG Network
  NEM
NEM  Bitcoin Gold
  Augur
Augur  Bitcoin Diamond