Solana price analysis: SOL stable at $36.94 after a bearish run

Solana price analysis reveals SOL prices are still holding above $36.94 amid the bearish winds. Solana movement over the last 24 hours shows the prices opened the daily trading session at lows of $42.05 and then proceeded to consolidate around $36.94 with a slight decrease of 10.24 percent. Solana price analysis indicates the market capitalization for the coin has also decreased marginally to $12 billion, while the 24-hour trading volume stands at $1.61 billion.
SOL/USD 1-day price analysis: Bears mount pressure
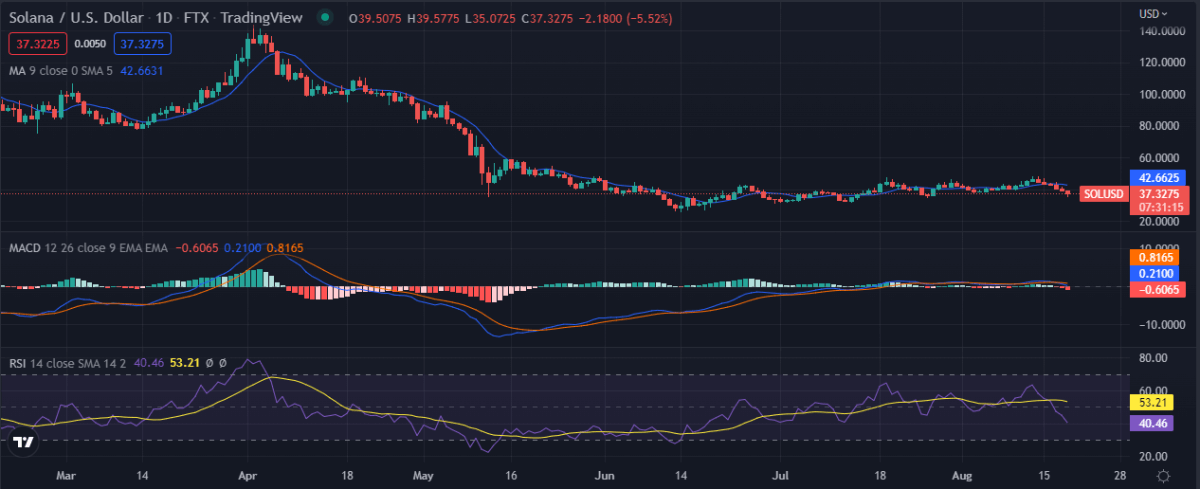
Solana price analysis on a daily chart reveals that during yesterday’s trading session, the prices formed a bearish engulfing candlestick pattern which led to the prices plunging today. The 50-day moving average is presently providing support at $35.76 and if the prices close below this level, it might result in SOL prices plummeting towards the $34 mark. The immediate resistance for the coin lies at $41.18 and if the bulls manage to push the prices above this level, we might see SOL prices rallying towards the $43 mark.

SOL/USD 1-day price chart, source: TradingView
The MACD indicator is presently in the bearish zone and is signaling a further decline in prices. The RSI indicator is also trading close to the oversold levels which might result in a price rebound in the near term. The bearish engulfing candlestick pattern on the daily chart is a bearish reversal signal which indicates that the prices might continue to decline in the near term.
SOL/USD 4-hour price analysis: Price decreases to $36.94
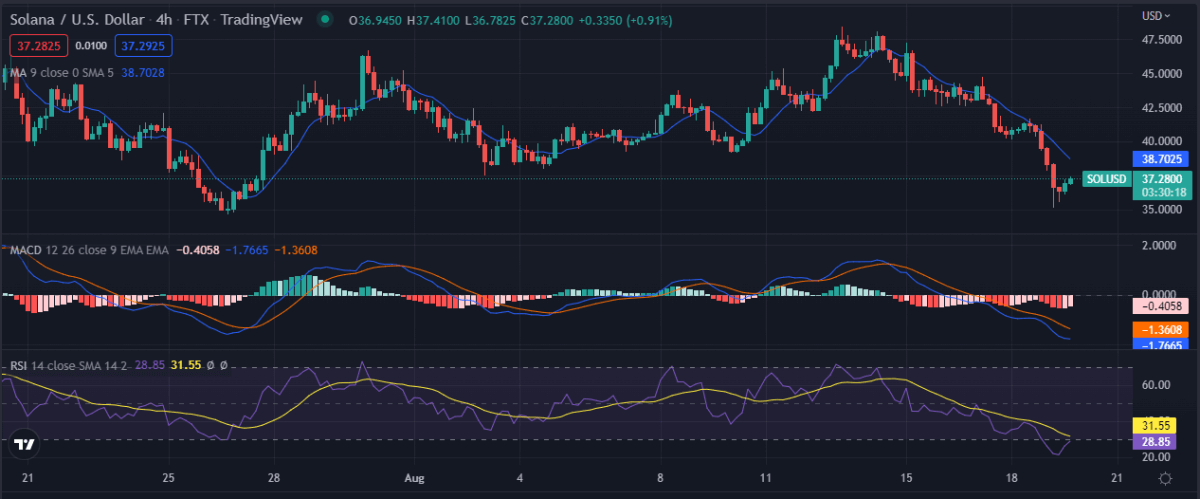
Solana price analysis on a 4-hour chart reveals that SOL/USD has been trading in a descending channel for the last few 4-hours. The price has been trading below both the 50-period moving average and the 200-period moving average which is a bearish sign. The bulls might try to push the prices towards the $41.18 resistance level but they are likely to face stiff selling pressure at this level.

SOL/USD 4-hour price chart, source: TradingView
The 4-hour Moving average convergence divergence indicator is below the centerline which is a bearish sign. The RSI indicator is presently trading at 55.97 which indicates that the prices might consolidate in the near term before making any further move. The descending channel on the 4-hour chart is a bearish continuation pattern which indicates that the prices might continue to decline towards the $34 mark.
Solana price analysis conclusion
To conclude, Solana price analysis indicates that the prices might continue to decline in the near term as the bearish trend continues. The investors should wait for the prices to stabilize before making any further moves. The Bulls and Bears are presently locked in a tug of war and it remains to be seen who will emerge victorious. The daily and four-hour chart is presently providing a bearish outlook for the coin and if the prices close below $35.76, it might result in a further decline.
Disclaimer. The information provided is not trading advice. Cryptopolitan.com holds no liability for any investments made based on the information provided on this page. We strongly recommend independent research and/or consultation with a qualified professional before making any investment decisions.


 Bitcoin
  Ethereum
  Tether
  USDC
USDC  TRON
TRON  Dogecoin
  Cardano
  Bitcoin Cash
  Chainlink
  LEO Token
  Zcash
Zcash  Monero
  Stellar
  Litecoin
  Hedera
  Dai
Dai  Cronos
  OKB
OKB  Tether Gold
  Ethereum Classic
  KuCoin
  Gate
Gate  Algorand
  Cosmos Hub
  VeChain
  Stacks
  Tezos
Tezos  Dash
Dash  TrueUSD
  IOTA
IOTA  Basic Attention
  Theta Network
  Decred
  NEO
NEO  Synthetix
  Qtum
Qtum  Ravencoin
  0x Protocol
  DigiByte
  Zilliqa
  Nano
Nano  Siacoin
  Numeraire
  Waves
Waves  Enjin Coin
  Status
  Ontology
  BUSD
BUSD  Hive
Hive  Lisk
Lisk  Pax Dollar
  Steem
Steem  Huobi
Huobi  OMG Network
  NEM
NEM  Bitcoin Gold
  Augur
Augur  Ren
Ren