STX Price Analysis: Is The STX Price Headed For A Rally?

- The STX price is currently trading at $0.8716 while seeing a change of -24% in 24-hour trading volume.
- The STX price is observing a decline of 0.48% in the last 24 hours.
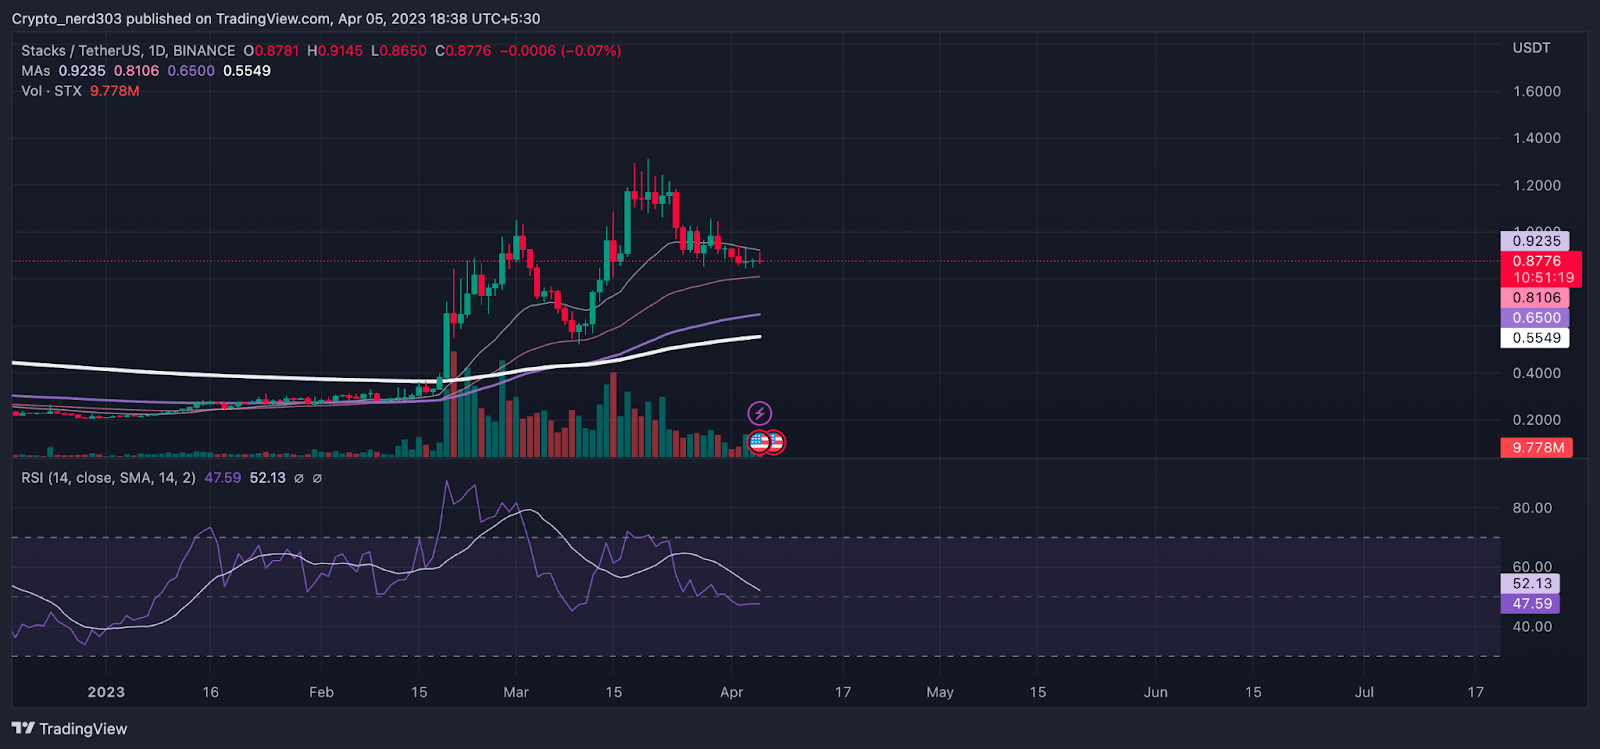
The STX price has been trading in a bullish trend for the last couple of months. This indicates that the STX price is getting the buyer’s fierce support. Although the price recently did make a bearish correction, the price is still forming a higher high and higher low pattern where the price is witnessing consistent support from the 50 EMA trading above the 200 EMA. It can be said that the overall trend of the market is still bullish despite the recent bearish sentiments. And the bulls might start making a bullish rally.
STX price trading near the supply zone on the (Daily Timeframe)

Source: STX/USDT by TradingView
In mid-February, the STX price after making a narrow convergence crossed above the 200 EMA with an extremely bullish candle pattern. Following this, it made an extremely bullish rally of more than 80%. The 20 EMA also made a bullish crossover over all the other major averages.
Our analysts predicted in early March that the Stacks price might take a correction because of the long divergence of price from the EMAs and the oscillators were also moving towards the oversold levels. This proved correct when after making a bearish candlestick pattern, the price made a downturn of 43%.
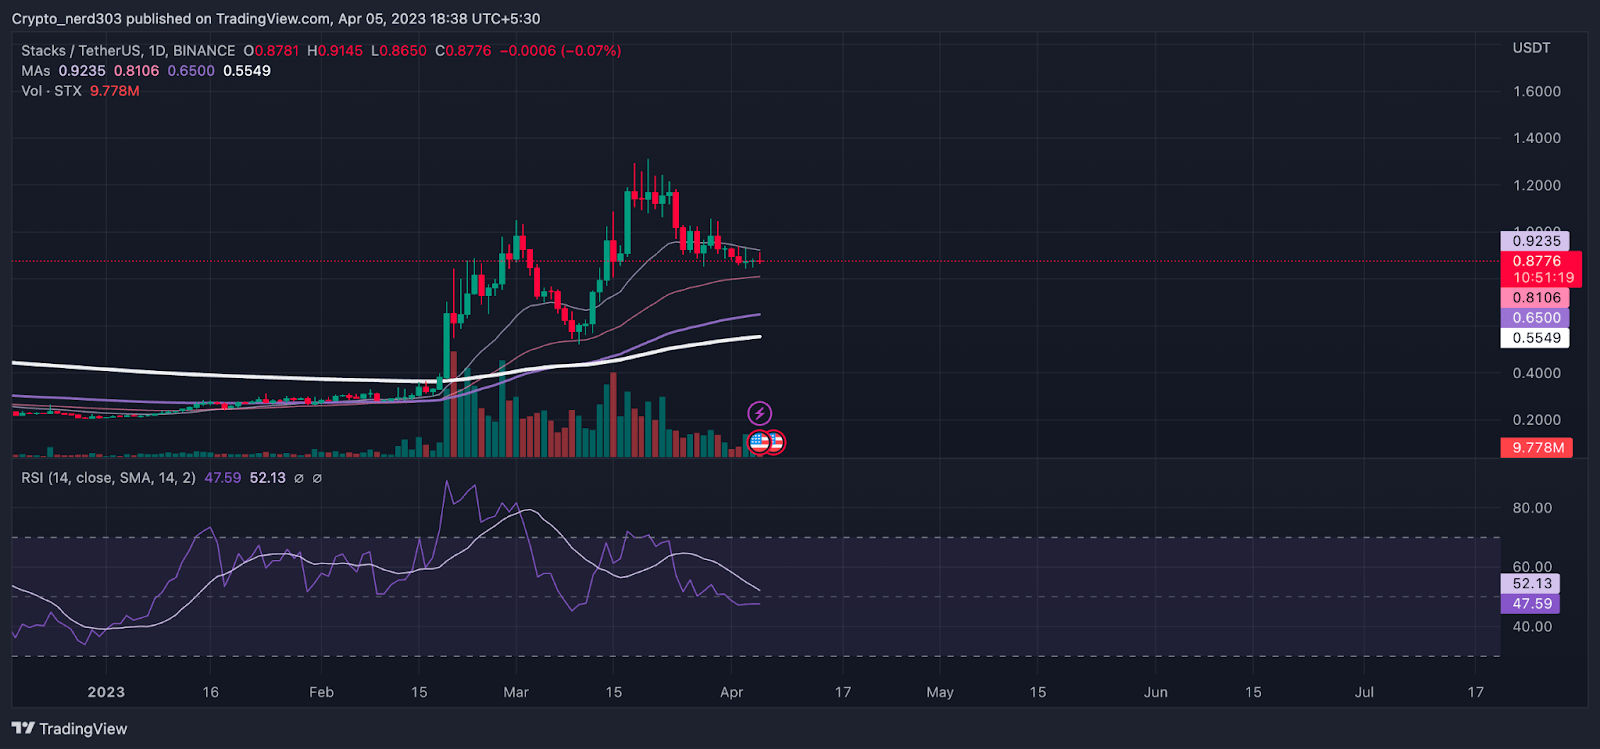
Technical Analysis ( 1 Day Timeframe )

Source: STX/USDT by TradingView
The overall market sentiments are currently in the greed zone of around 62 points in the greed and fear index. The market sentiments are observing an increase of 5 points since the last week when they were around 57 points according to Alternative(dot)me, a platform that measures the market sentiments through different sources. As per Coinglass, the sellers are currently overwhelming most of the major cryptocurrency trading platforms.
Conclusion
As of now, the STX price is trading near the 50 EMA which is its previous support level. The price is also trading above the 200 EMA where all the EMA’s are trading in an ascending order, which indicates that the price is trading in a bull trend. And the current price action suggests that it can take a bullish reversal. If the price takes support from the current level, it can make a bullish rally of 50%. While its nearest support is 10% below the present price of $0.7600. The price is offering a 5:1 risk and reward ratio.
Technical levels –
Support -$0.7600
Resistance – $1.3000
Disclaimer
The views and opinions stated by the author, or any people named in this article, are for informational purposes only, and they do not establish financial, investment, or other advice. Investing in or trading crypto assets comes with a risk of financial loss.


 Bitcoin
  Ethereum
  Tether
  USDC
USDC  TRON
TRON  Dogecoin
  Cardano
  Bitcoin Cash
  Monero
  Chainlink
  LEO Token
  Stellar
  Zcash
Zcash  Litecoin
  Hedera
  Dai
Dai  Cronos
  Tether Gold
  OKB
OKB  Ethereum Classic
  KuCoin
  Cosmos Hub
  Gate
Gate  Algorand
  Dash
Dash  VeChain
  Tezos
Tezos  Stacks
  TrueUSD
  Decred
  IOTA
IOTA  Theta Network
  Basic Attention
  NEO
NEO  Synthetix
  Qtum
Qtum  0x Protocol
  Ravencoin
  DigiByte
  Zilliqa
  Nano
Nano  Siacoin
  Numeraire
  Waves
Waves  Enjin Coin
  Ontology
  Status
  BUSD
BUSD  Hive
Hive  Pax Dollar
  Lisk
Lisk  Steem
Steem  Huobi
Huobi  OMG Network
  Bitcoin Gold
  NEM
NEM  Augur
Augur