These 5 Altcoins Bore the Brunt of This Week’s Crypto Market Collapse

BeInCrypto looks at the five biggest altcoins losers in the entire cryptocurrency market this week, specifically from March 3 to 10.
The altcoins that have fallen the most in the entire altcoin market are:
- Stacks (STX) price fell by 32.71%
- SingularityNET (AGIX) price fell by 30.81%
- Mina (MINA) price fell by 29.43%
- Render Token (RNDR) price fell by 28.77%
- Dash (DASH) price fell by 24.98%
Stacks (STX) Price Leads Crypto Market Losers
The Stacks price has decreased since reaching a high of $1.05 on March 1. The altcoin broke down from an ascending parallel channel on March 4, reaching a low of $0.59 on March 9.
Currently, the cryptocurrency price is trading just above the 0.618 Fib retracement support level at $0.53. While the area could initiate a bounce, the RSI has not generated any bullish divergence yet.
If the decrease continues, the next closest support area would be at $0.40. On the other hand, if a bounce occurs, the STX price could increase to $0.63.
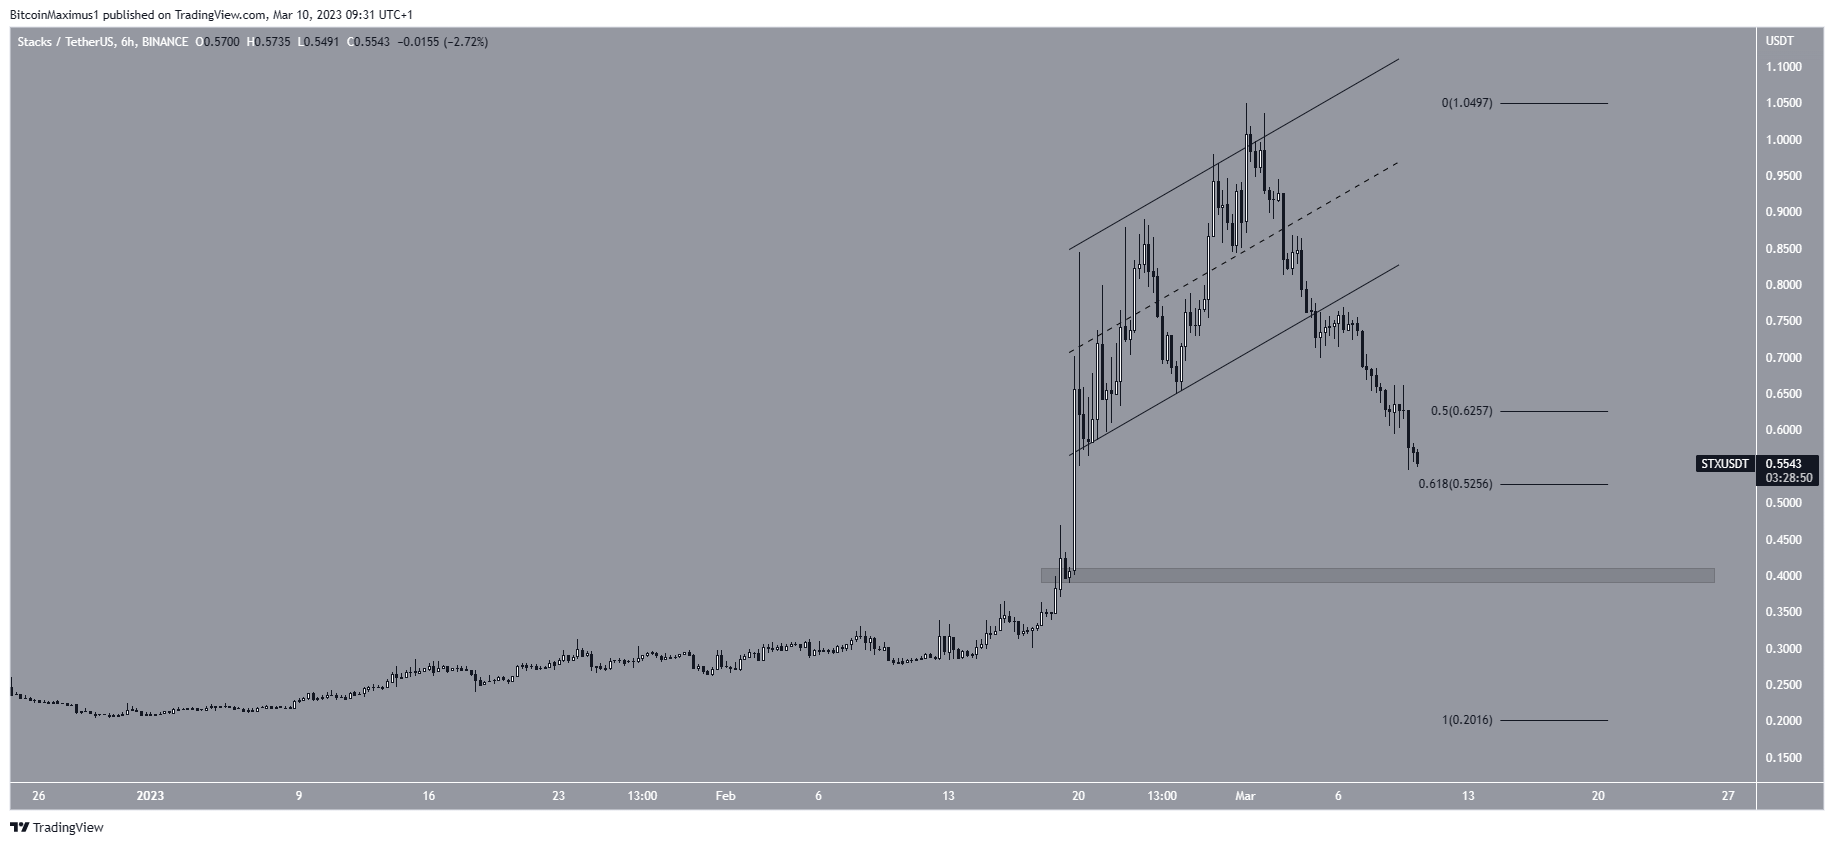
STX/USDT Daily Chart. Source: TradingView
SingularityNET (AGIX) Price Risks Further Breakdown
The AGIX price has fallen since reaching a high of $0.67 on Feb. 8. It created a lower high (red icon) on March 1 and resumed its descent afterward. On March 9, it broke down from the 0.5 Fib retracement support level at $0.36.
If the decrease continues, the altcoin could fall to the 0.618 Fib retracement support level at $0.28.
However, AGIX could retest the $0.36 level if a bounce occurs.
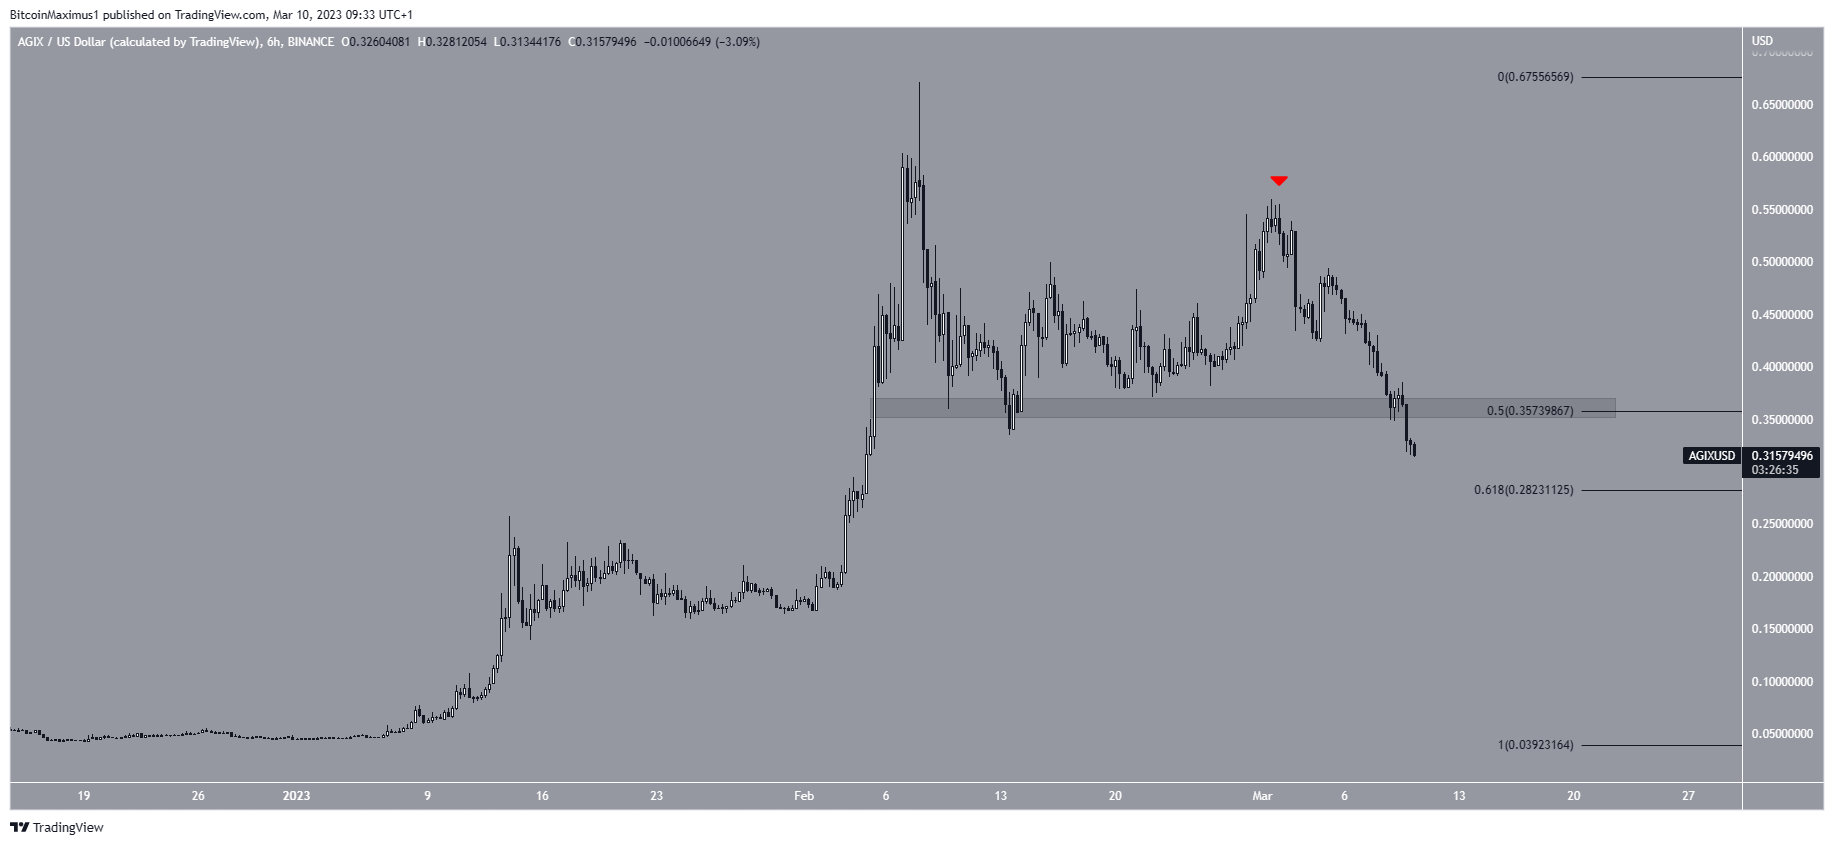
AGIX/USD Daily Chart. Source: TradingView
Mina (MINA) Resumes Fall
The MINA price has fallen sharply since reaching a high of $1.25 on Feb. 16. This caused a deviation above the $1.17 resistance area. The rate of decrease accelerated on March 3.
Currently, the crypto is approaching the $0.57 horizontal support area and is expected to reach it.
On the other hand, if the price bounces, it could retest the $0.82 area and validate it as resistance.
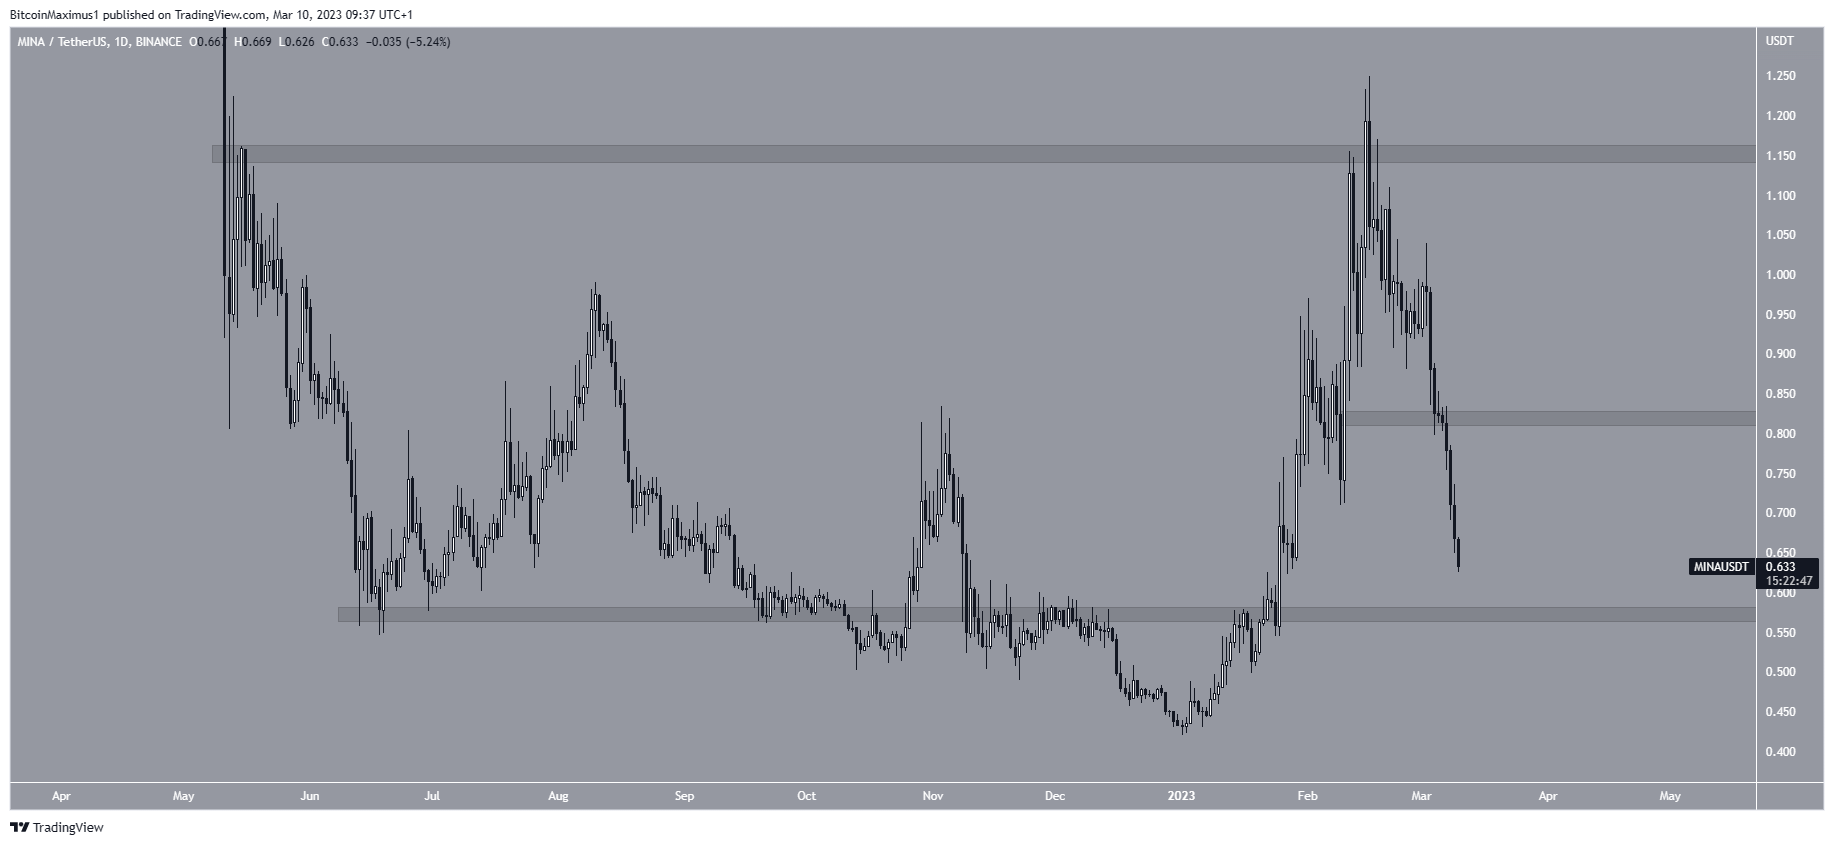
MINA/USDT Daily Chart. Source: TradingView
Render Token (RNDR) Falls After Parabola Breaks Down
The RNDR price has decreased since Feb. 7 when it reached a high of $2.19. It created a lower high on Feb. 16 and accelerated its rate of decrease afterward.
Currently, the digital asset trades below the 0.618 Fib retracement support level at $1.08. If the drop continues, the closest support would be at $0.77. On the other hand, if RNDR regains momentum, it could retest the $1.07 area once more.
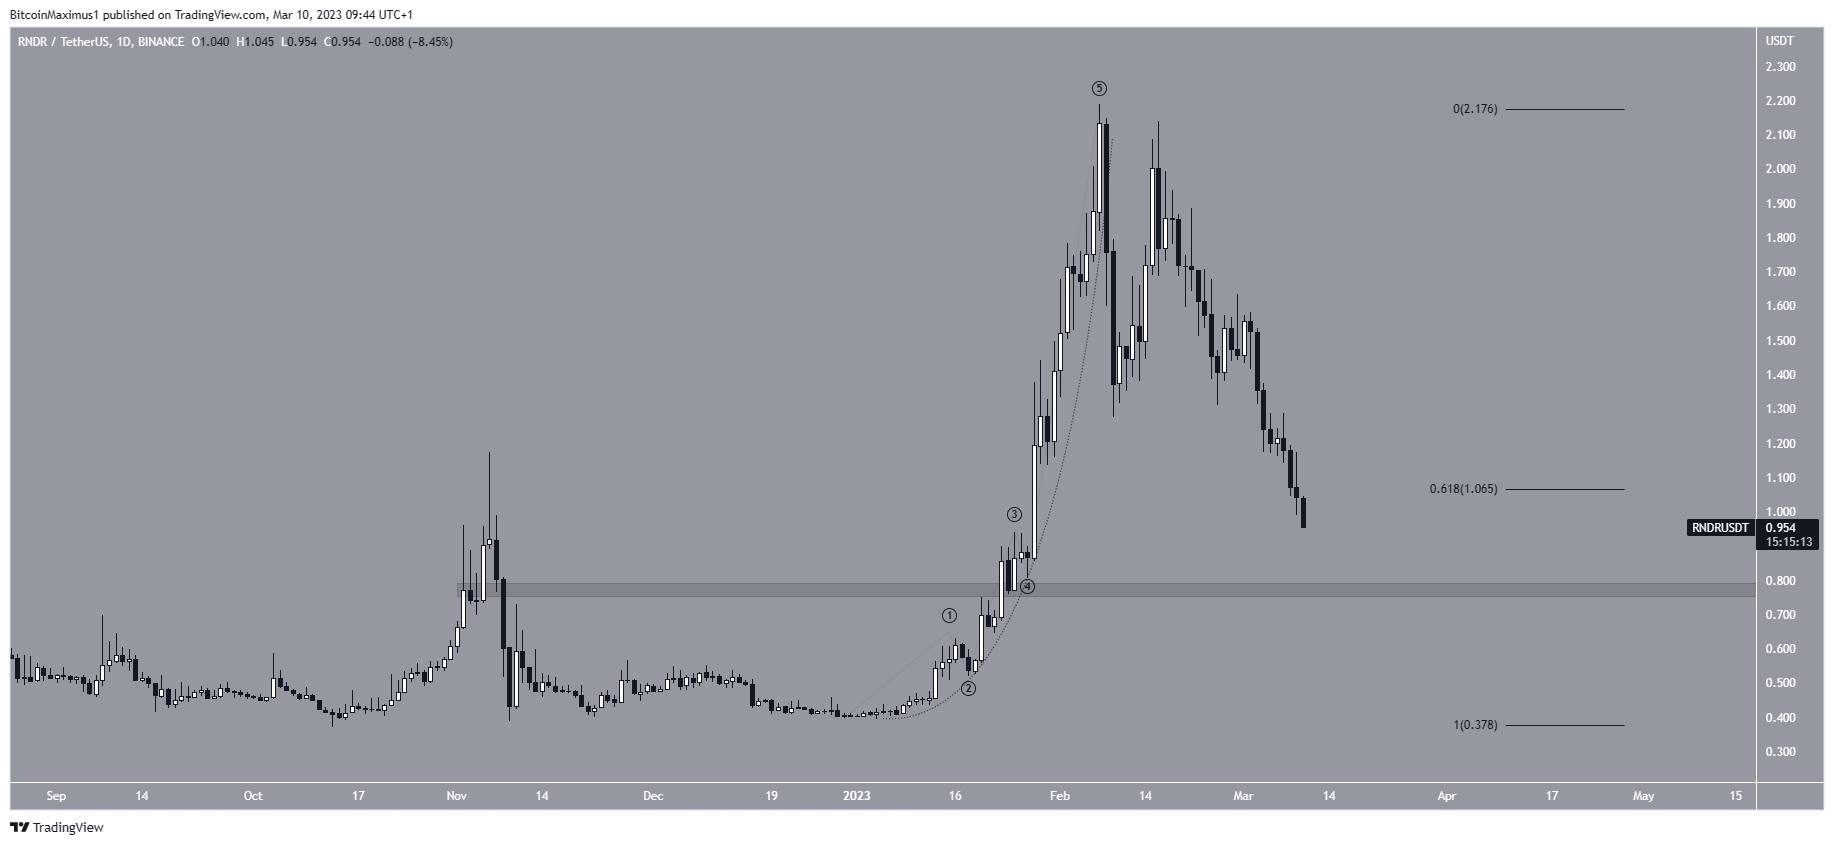
RNDR/USDT Daily Chart. Source: TradingView
Dash (DASH) Breaks Down From Ascending Support
The DASH price has fallen since reaching a high of $77.90 on Feb. 16. The price created a lower high at the beginning of March and accelerated its rate of decrease afterward. On March 9, DASH broke down from an ascending support line.
If the decrease continues, the closest support area would be at $49.
On the other hand, if the crypto asset regains momentum, it could retest the ascending support line at $60.

DASH/USDT Daily Chart. Source: TradingView


 Bitcoin
  Ethereum
  Tether
  USDC
USDC  TRON
TRON  Dogecoin
  Cardano
  Bitcoin Cash
  Zcash
Zcash  Chainlink
  Monero
  LEO Token
  Stellar
  Litecoin
  Hedera
  Dai
Dai  Cronos
  Tether Gold
  OKB
OKB  Ethereum Classic
  KuCoin
  Gate
Gate  Algorand
  Cosmos Hub
  VeChain
  Dash
Dash  Tezos
Tezos  TrueUSD
  Stacks
  IOTA
IOTA  Decred
  Basic Attention
  Theta Network
  NEO
NEO  0x Protocol
  Synthetix
  Qtum
Qtum  Ravencoin
  DigiByte
  Nano
Nano  Zilliqa
  Siacoin
  Numeraire
  Waves
Waves  Ontology
  Status
  BUSD
BUSD  Enjin Coin
  Hive
Hive  Pax Dollar
  Lisk
Lisk  Steem
Steem  Huobi
Huobi  NEM
NEM  OMG Network
  Bitcoin Gold
  Augur
Augur  Bitcoin Diamond
  Ren
Ren