Top 3 Price Prediction Bitcoin, Ethereum, Ripple: Defi Volatility & Emerging Trends
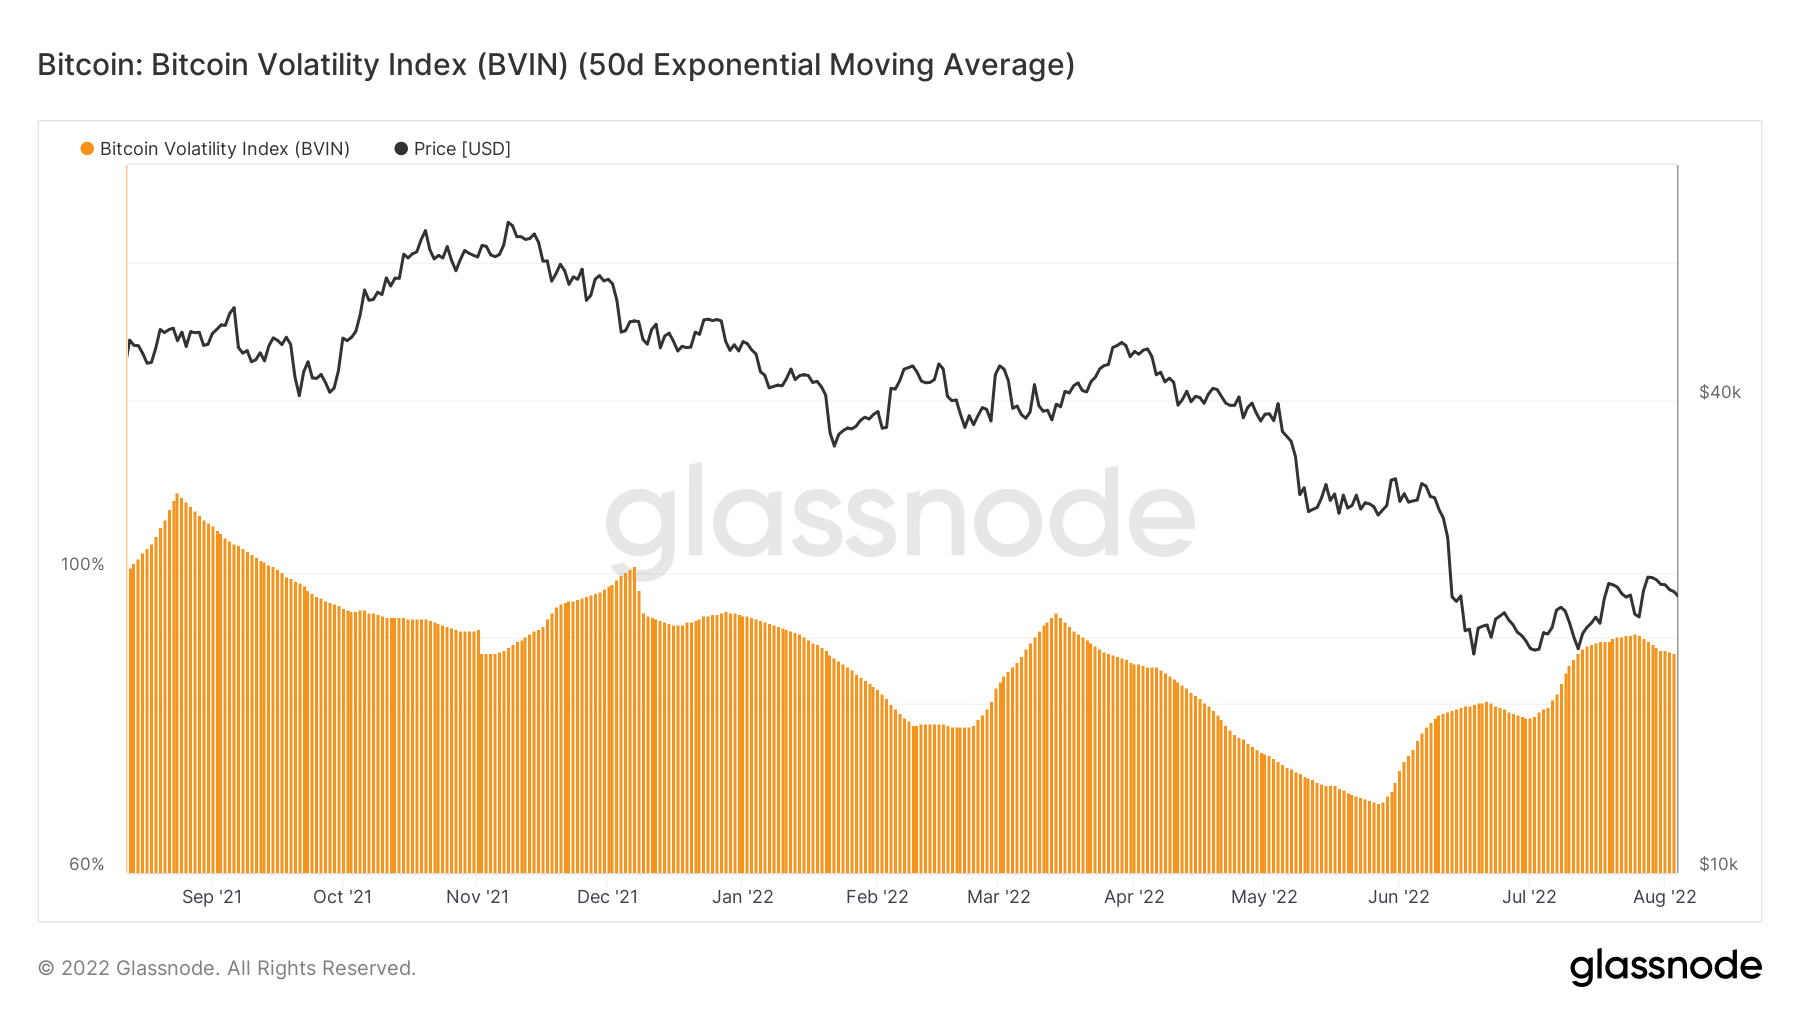
- According to the Bitcoin Volatility Index, the bitcoin price remains submerged in terms of trading interest.
- Ethereum continues to show strength in the market but for how long?
- Ripple price shows contrarian bullish signals.
The Crypto market shows a shift in the tides. Market dominance may be dished off to Ethereum and Ripple in the coming weeks
Bitcoin price shows turbulence
Bitcoin price has halted all bullish production. The peer-to-peer digital currency has been experiencing erratic behavior since it hurdled the $21,000 barrier towards the end of July. Traders may continue to sideline their accounts in the coming days as the technicals suggest a wedging pattern is likely underway.
Turbulent behavior in Bitcoin price could signal disinterest amongst short-term bulls and bears alike. An On-Chain analysis indicator called the Bitcoin Volatility Index (BVIN) confounds the unpredictability that continues to plague. The BVIN shows declining volatility in net and cumulative volume, displayed by a steadily decreasing 50-day exponential moving average (EMA). Thus a sideline approach may be justified for weeks until a substantial cue presents itself.
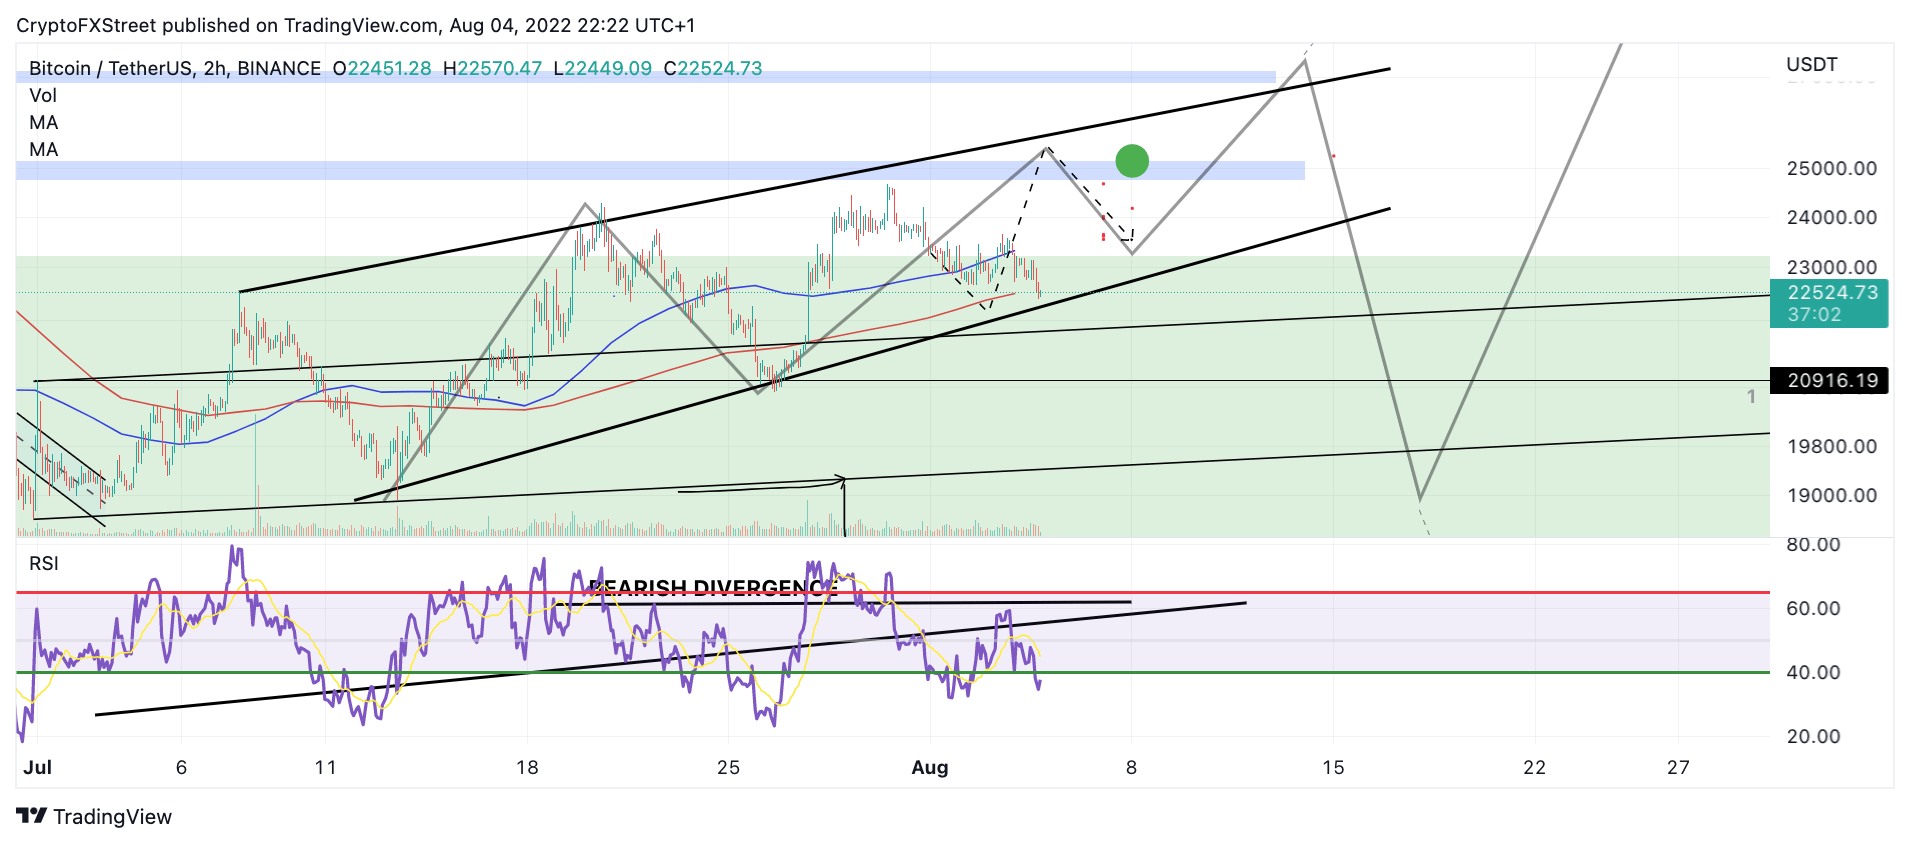
BTC/USDT/2-Hour Chart
In the following video, our analysts deep dive into the price action of Bitcoin, analyzing key levels of interest in the market. -FXStreet Team
Ethereum price set to outperform
Ethereum price continues to show strength in the market. Despite the negative sentiment hovering in the ecosystem around which merge solution the community should take. The maintenance above $1,500 should continue to be bullish in the short term.
The earliest detection of a weakening trend will be a failure to hold support near the $1,350 level, which leaves 15% of wiggle room from the current Ethereum price at $1,594. Updates will be issued throughout the week as the digital asset shows the potential to outperform its Bitcoin counterpart.
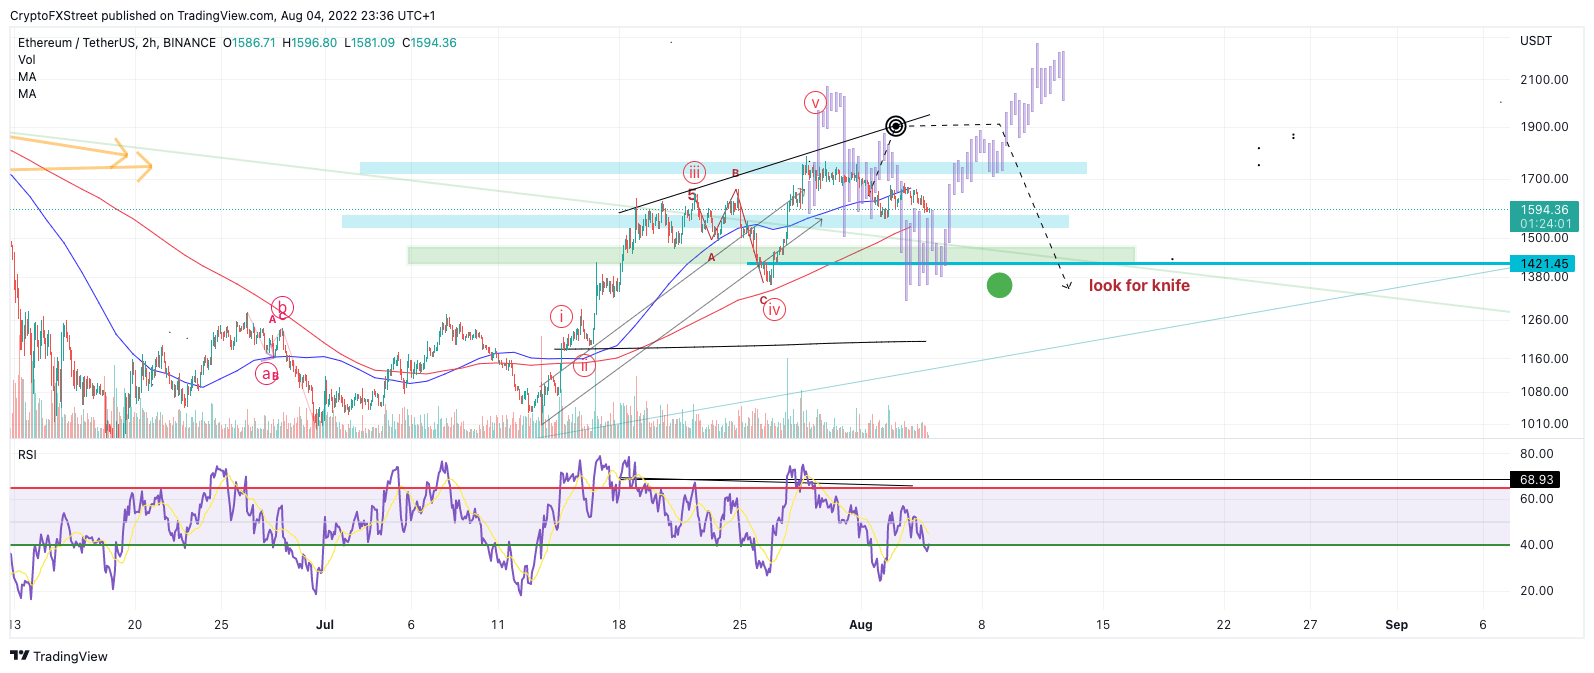
ETH/USDT 3-Hour Chart
In the following video, our analysts deep dive into the price action of Ethereum, analyzing key levels of interest in the market. -FXStreet Team
Xrp price shows stregnth
Ripple’s XRP price auctions at $0.358 as the bulls continue to show optimism. XRP price is currently holding ground above a critical trend line which can be viewed as a quiet storm in the making. The bulls appear to be aiming for macro targets at $0.48 and $0.50. A breach of these levels could induce a bull rally targeting $1.20 in the future, resulting in a 180% increase from the current Ripple price.
Invalidation of the uptrend depends on the bulls holding ground at the $0.325 level. Should the bears breach this critical line in the sand, a plummet towards new all-time lows for 2022 could occur. Bearish targets lie between $0.20-$0.24 for up to a 45% decrease from the current Ripple price.
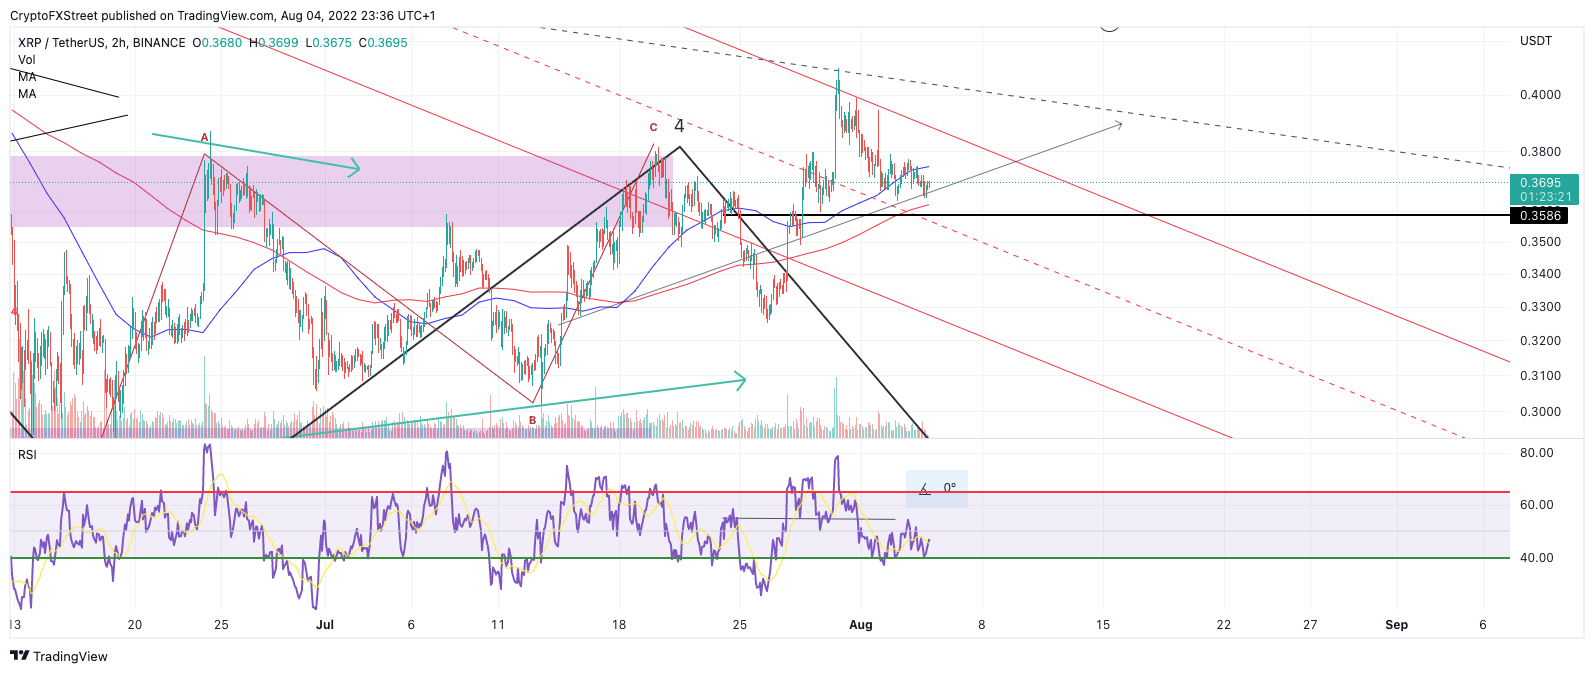
XRP/USDT 3-Hour Chart
I’m In the following video, our analysts deep dive into the price action of Ripple, analyzing key levels of interest in the market. -FXStreet Team


 Bitcoin
  Ethereum
  Tether
  USDC
USDC  TRON
TRON  Dogecoin
  Cardano
  Monero
  Bitcoin Cash
  Chainlink
  LEO Token
  Stellar
  Zcash
Zcash  Litecoin
  Hedera
  Dai
Dai  Cronos
  OKB
OKB  Tether Gold
  Ethereum Classic
  KuCoin
  Cosmos Hub
  Algorand
  Gate
Gate  Dash
Dash  VeChain
  Stacks
  Tezos
Tezos  TrueUSD
  IOTA
IOTA  Decred
  Theta Network
  Basic Attention
  NEO
NEO  Synthetix
  Qtum
Qtum  Ravencoin
  0x Protocol
  DigiByte
  Zilliqa
  Nano
Nano  Siacoin
  Numeraire
  Waves
Waves  Ontology
  Enjin Coin
  Status
  Hive
Hive  BUSD
BUSD  Pax Dollar
  Lisk
Lisk  Steem
Steem  Huobi
Huobi  OMG Network
  Bitcoin Gold
  NEM
NEM  Augur
Augur  Bitcoin Diamond