Trading strategy based on the BTC-ETH Spread

There is a type of trading called a spread, in which one goes in search of instruments with high correlation thresholds, to take advantage of the small differences that arise between two (or more) underlyings over time.
The main strategy in this area is the spread between bonds. For example, the spread between the 30-year U.S. Future and the 10-year U.S. Future. These are both highly correlated products, but because of the different duration, they accumulate spreads that are exploitable in a systematic way.
These trades encapsulate as much as 70% of the total trades that occur in the bond markets. Without getting too much into the technicalities of bond spreads, this article will look at a spread strategy applied to cryptocurrencies. Tests will be run on the best-known pair on which the deepest historical data are available: Bitcoin and Ethereum.
Summary
- Rules for the BTC-ETH Spread-Based Strategy
- Backtest of the “BTC-ETH Spread” strategy.
- Conclusions of the strategy
Rules for the BTC-ETH Spread-Based Strategy
Noting that Bitcoin and Ethereum are the two most important cryptocurrencies, and as such are correlated with each other, one can think of taking the route of spread trading with these two instruments. Technically, the operation consists of simultaneously buying and selling the same monetary amount on BTC and ETH. When the strategy will be in a long (buy) position on BTC it will have to be short (sell) on ETH at the same time, and vice versa.
This type of operation, which involves 100% of the time in the market to take opposite positions, allows one to somehow always be sheltered from strong shocks in the cryptocurrency sector, such as the one that occurred in early 2022. With this type of entry, the strategy will always be “hedged,” or protected, by an opposing position on a highly correlated instrument. This means that even losses, at times when the strategy will suffer, will still be limited. The same reasoning unfortunately also applies to gains, which will be restrained by the “hedging” system.
The data that will be used begin in 2018 and last until July 2022. The time frame on which the strategy will be executed is 1440 minutes, which corresponds to 24 hours, or one trading day.
The strategy is based on the spread between BTC and ETH, and it is the spread that will provide the indications on when to buy BTC and when, instead, to buy ETH.
Figure 1 shows the value of ETH in BTC prices: as can be seen, there is no clear and precise upward or downward trend, at least not in the last 4 years. Nevertheless, the value of ETH in BTC has risen over time in alternating moments. In fact, there are periods when the spread is very volatile and jumpy to times when it flattens out.
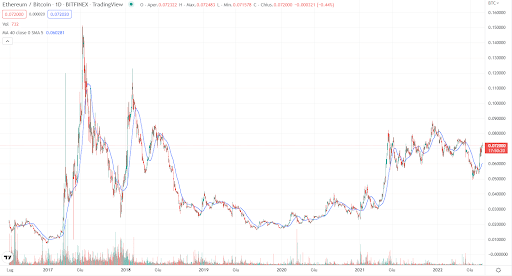
Figure 1. ETH/BTC
So to separate the “pump” moments from the “dump” moments of the spread, a 40-day moving average will be used. When the spread crosses the average upward, one will buy ETH and sell BTC. Consequently, when the spread crosses its average downward, one will buy BTC and sell ETH. In this way, the strategy will always be at market with opposite positions.
Backtest of the “BTC-ETH Spread” strategy.
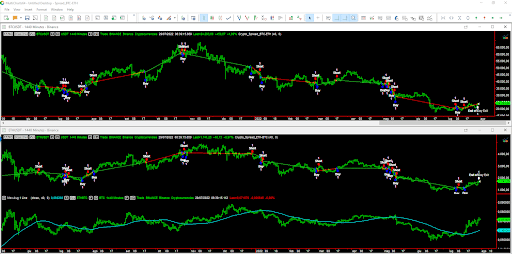
Figure 2. Example of opposing entries on BTC-ETH.
An example of the strategy’s trades can be seen in Figure 2, where it can be seen that they occur simultaneously. This is done to safeguard the basic idea of spread trading, whereby the hedge of the position must never be allowed to lapse, otherwise the main premise of the strategy would be lost.
Like all spread strategies, this one also involves both long and short trades.
Tests are conducted on spot cryptocurrencies. A fixed monetary size is used for both BTC and ETH, corresponding to $10,000 each, taking prices from the world’s largest cryptocurrency exchange such as Binance, which allows one to scale one’s position up to more than 1/1000 of Bitcoin, equivalent to about $23 today.
Figures 3 through 5 show the results this strategy produces.

Figure 3. Average trade
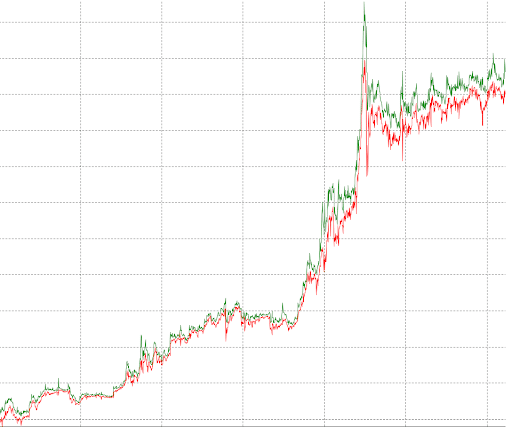
Figure 4. Equity line
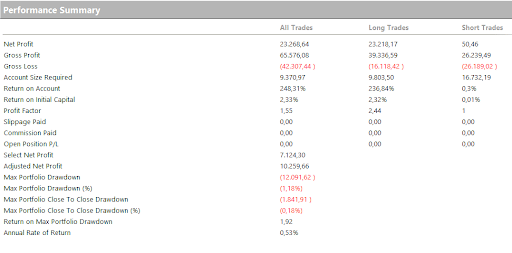
Figure 5. Performance Summary
It is immediately noticeable that the profit curve is increasing (figure 1). Above all, the average trade (figure 2) seems to be capacious enough to pay back the commission costs and slippage that, like it or not, one will face in live trading. The figure for the value of an average trade is around $170, or 1.7% of the value of the position taken.
When trading in spreads, it is good to remember that commissions and slippage impact twice as much as in a traditional strategy. This happens because, in spread strategies, a single trade actually comprises two separate trades, one long and one short. Therefore, it takes even more importance to read the value on the average trade, since operating in spreads is more expensive than operating classically.
The maximum drawdown of -$12,000 occurs as a result of a very strong rally in the strategy, which then saw most of those profits taken back. Apart from this rare episode, the strategy remains at drawdown levels commensurate with the returns it provides.
Conclusions of the strategy
These initial tests conducted on the spread between BTC and ETH can be considered satisfactory. It was seen that the indications provided can also be exploited to some extent in live trading.
Furthermore, what has emerged is that spread trading does indeed provide that much-vaunted protection. See the behavior of the equity line in the last phase of the backtest, where in the face of large declines seen in 2022 on both cryptocurrencies analyzed, the spread strategy would have allowed for a more peaceful sleep.
This was, as stated at the beginning of the article, at the expense of profits, which would undoubtedly have been greater through simple buy-and-hold but would likely have led to high stress in bearish moments.
That is all for this article, see you next time.
Happy trading!



 Bitcoin
  Ethereum
  Tether
  USDC
USDC  TRON
TRON  Dogecoin
  Cardano
  Bitcoin Cash
  Chainlink
  Monero
  LEO Token
  Zcash
Zcash  Stellar
  Litecoin
  Hedera
  Dai
Dai  Cronos
  Tether Gold
  OKB
OKB  Ethereum Classic
  KuCoin
  Gate
Gate  Algorand
  Cosmos Hub
  VeChain
  Dash
Dash  TrueUSD
  Tezos
Tezos  Stacks
  IOTA
IOTA  Basic Attention
  Theta Network
  Decred
  NEO
NEO  Synthetix
  Qtum
Qtum  Ravencoin
  DigiByte
  0x Protocol
  Nano
Nano  Zilliqa
  Holo
Holo  Siacoin
  Numeraire
  Waves
Waves  Status
  BUSD
BUSD  Enjin Coin
  Pax Dollar
  Ontology
  Hive
Hive  Lisk
Lisk  Steem
Steem  Huobi
Huobi  OMG Network
  NEM
NEM  Bitcoin Gold
  Augur
Augur  Ren
Ren  HUSD
HUSD