TRX Price Analysis: Will TRX Price continue its bull trend?
- 1 TRX/USDT is currently trading at $0.069 while seeing a change in 24 hours of 1.%.
- 2 The total market cap of TRON is $6.2B whereas it has a circulating supply of 91B.
The TRX coin is seeing a significant increase in buyers within the last few months. According to DefiLama the fees and revenue of TRON tokens reached their all-time high near late April which indicates that a significant number of buyers have been onboarded with the TRON platform.
The TVL (Total Value Locked) has been moving at an all-time high level showing the trust of buyers within the token. The present TVL of TRON is 5.5B observing a change of 1.24% within the last 24 hours. In comparison to TVL, the price of TRX is seeing a sharp decline
Steady Increase in Fees and TVL of TRX Token
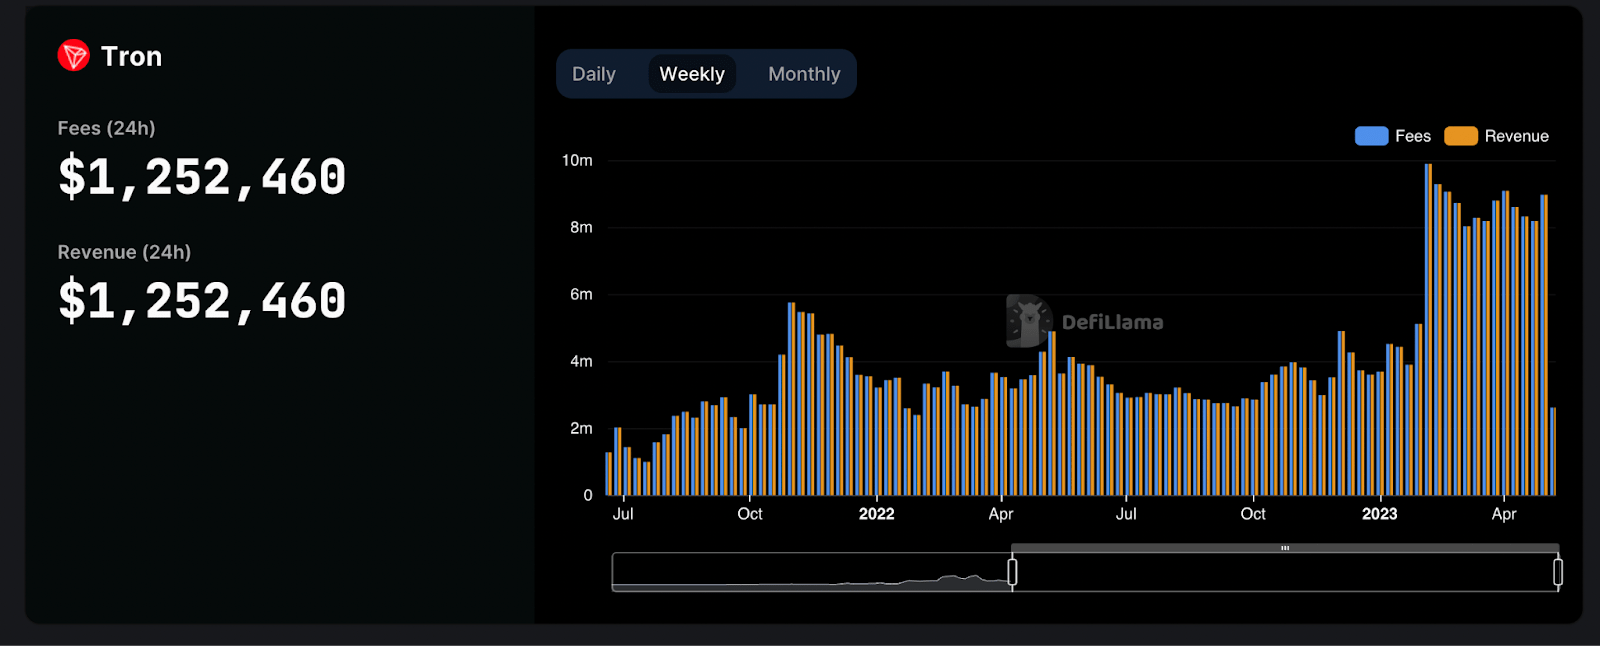
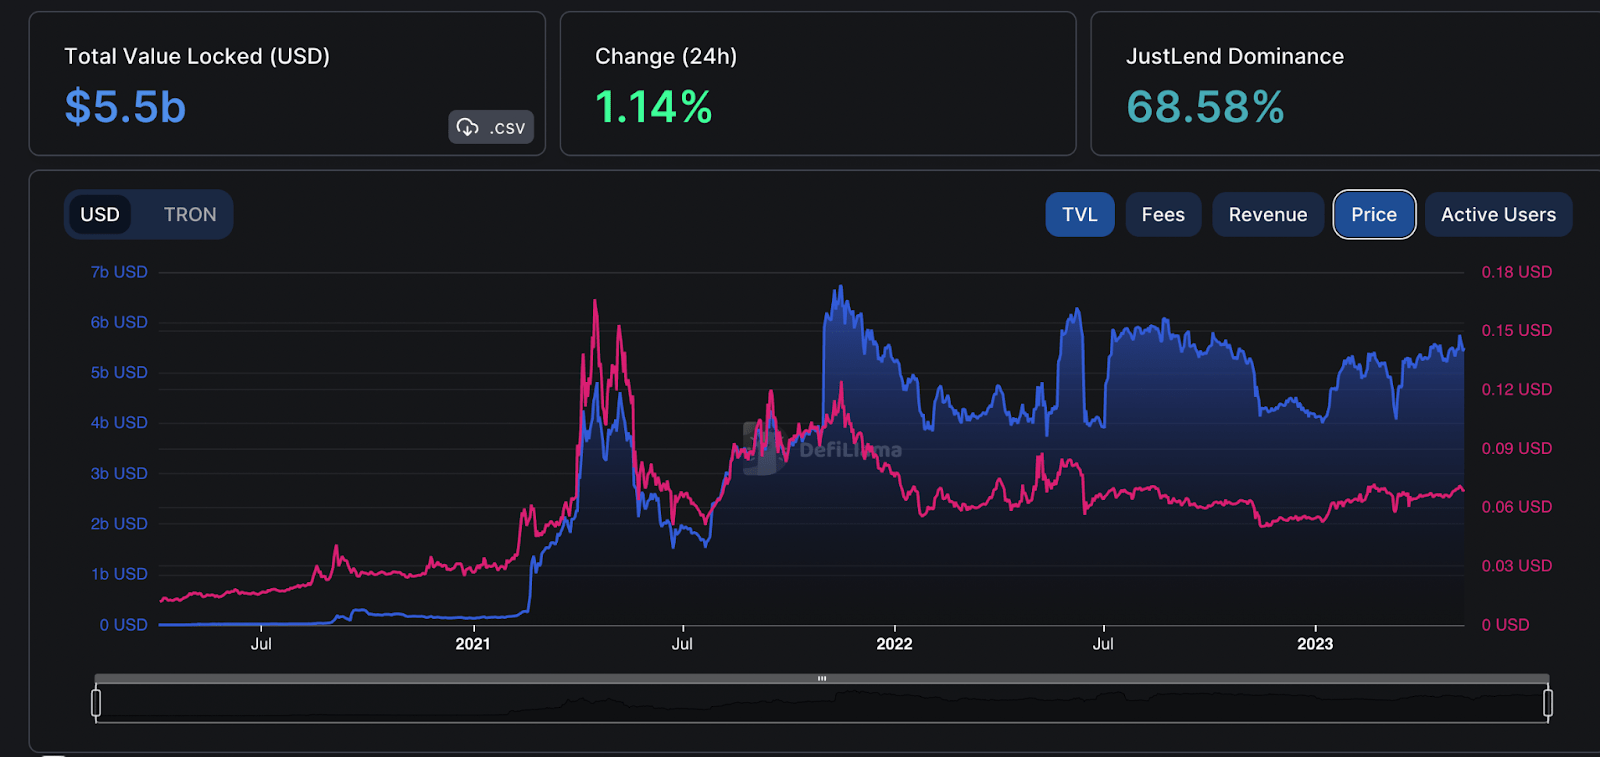
Source: TRX/USDT by DefiLama
The Investors are showing a decline in their interest in the TRX token across most of the social media platforms according to total social engagement metrics provided by LunarCrush. The Total Social Engagement rate is experiencing a decline of 15.64% within the last few weeks. Though there is a positive surge in Social Dominance of 6.54%.
Social Engagement and Dominance Comparison of NEO Token
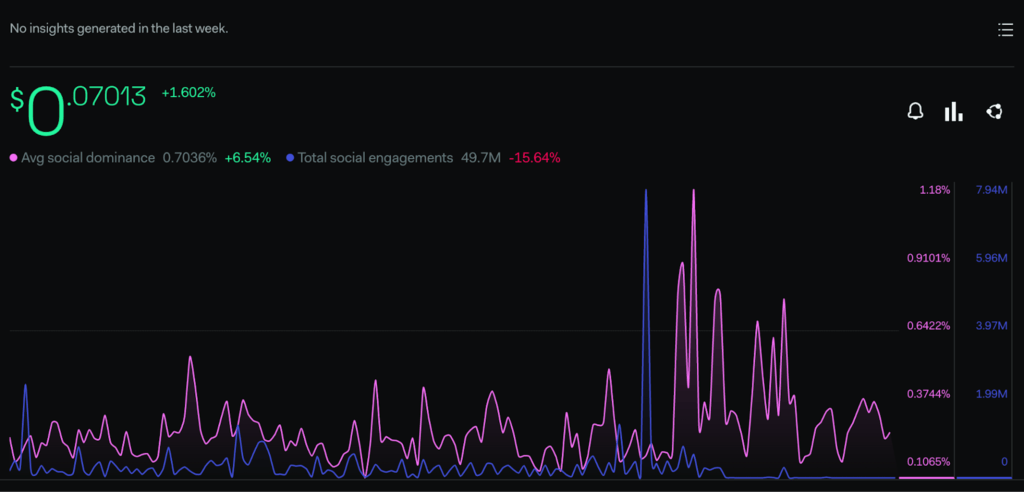
Source: TRON/USDT by LunarCrush
The majority of the market sentiments are observing a significant decline since last week, The current value of market sentiments in the greed and fear index is 52 points. It is seeing a decrease of 12 points within a few weeks where the sentiments were at 64. As per the greed and fear index, provided by the Alternative (dot) me platform.
Most of the cryptocurrency exchanges are currently witnessing a fierce struggle between the buyers and sellers where the buyers are prominent around some exchanges. The buyers are dominating 50 – 59% of the market across the majority of the exchanges.
Technical Analysis (1-Day Timeframe )
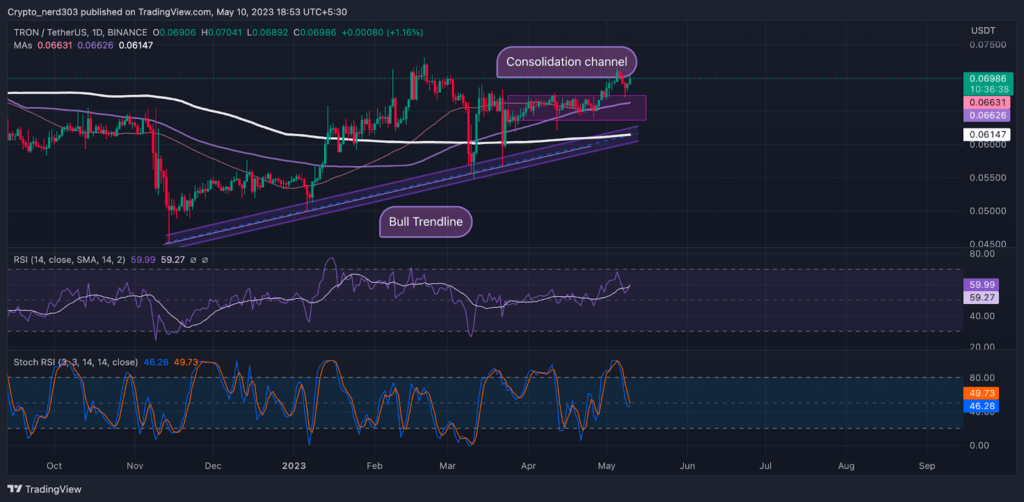
Source: TRX/USDT by TradingView
The RSI line has recently taken a reversal from the median line; it is crossing above 14 SMA. The current value of RSI is 59.99 point’s which is trading below the 14 SMA. The current value of 14 SMA is 59.27 points. The RSI line is taking a bullish turn though as it is trading near the overbought zone a negative reversal is possible in near future.
Presently, the Stochastic RSI is also indicating a bullish reversal through the median line. %K line is giving a positive crossover to the %D line. The current value of Stochastic RSI is 49.73 points.
Conclusion
Analysing various technical metrics it can be estimated that the TRON price is bullish regarding the future trend.
Technical levels –
Support -$0.06600
Resistance – $0.07500
Disclaimer
The views and opinions stated by the author, or any people named in this article, are for informational purposes only, and they do not establish financial, investment, or other advice. Investing in or trading crypto assets comes with a risk of financial loss.


 Bitcoin
  Ethereum
  Tether
  USDC
USDC  TRON
TRON  Dogecoin
  Cardano
  Bitcoin Cash
  Chainlink
  Monero
  LEO Token
  Zcash
Zcash  Stellar
  Litecoin
  Hedera
  Dai
Dai  Cronos
  Tether Gold
  OKB
OKB  Ethereum Classic
  KuCoin
  Gate
Gate  Algorand
  Cosmos Hub
  VeChain
  TrueUSD
  Dash
Dash  Tezos
Tezos  Stacks
  IOTA
IOTA  Basic Attention
  Theta Network
  Decred
  NEO
NEO  Synthetix
  Qtum
Qtum  Ravencoin
  DigiByte
  0x Protocol
  Nano
Nano  Zilliqa
  Siacoin
  Numeraire
  Waves
Waves  BUSD
BUSD  Status
  Pax Dollar
  Enjin Coin
  Ontology
  Hive
Hive  Lisk
Lisk  Steem
Steem  Huobi
Huobi  NEM
NEM  OMG Network
  Bitcoin Gold
  Augur
Augur  Ren
Ren  HUSD
HUSD