Will Solana (SOL) Price End March on a Happier Note?

The Solana (SOL) price is expected to increase toward $27. The reaction once it gets there could determine the future trend.
SOL is the native token of the Solana blockchain, created by Anatoly Yakovenko. The Solana Network Grizzlython Hackathon ended on March 14. Grizzlython is an online hackathon for the Solana ecosystem. In it, builders submit their projects and compete with others over a six-week period, and the winner has an opportunity to raise seed funding from prominent crypto investors aided by the Solana Foundation.
Solana (SOL) Price Reaches Critical Level
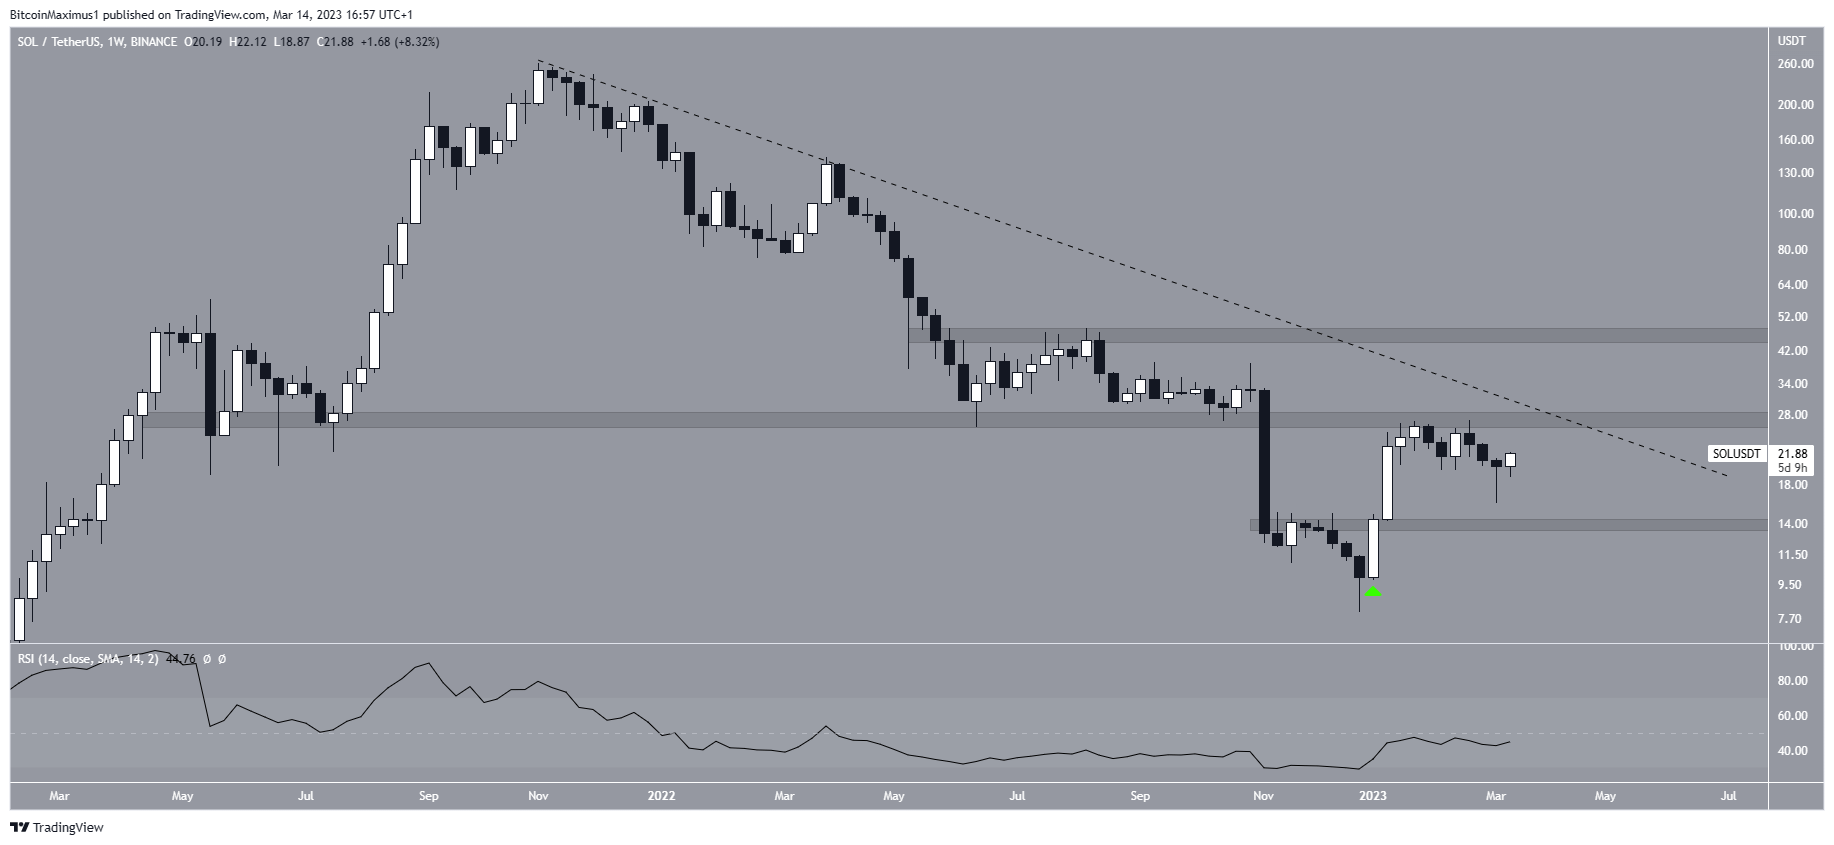
The Solana price has fallen under a descending resistance line since reaching an all-time high price of $259.90 in November 2021. The decrease led to a low of $8 in December 2022. The SOL price reversed the trend immediately afterward, creating a bullish engulfing candlestick next week (green icon).
Despite the increase, the SOL price failed to move above the $27 resistance area or the descending resistance line. Furthermore, the weekly RSI is still below 50. Therefore, the trend cannot be considered bullish yet.
If a breakout occurs, the next closest resistance would be at $47. On the other hand, a rejection could lead to a drop to the $14 support area.

SOL/USDT Weekly Chart. Source: TradingView
Solana (SOL) Price Recovers After Fall
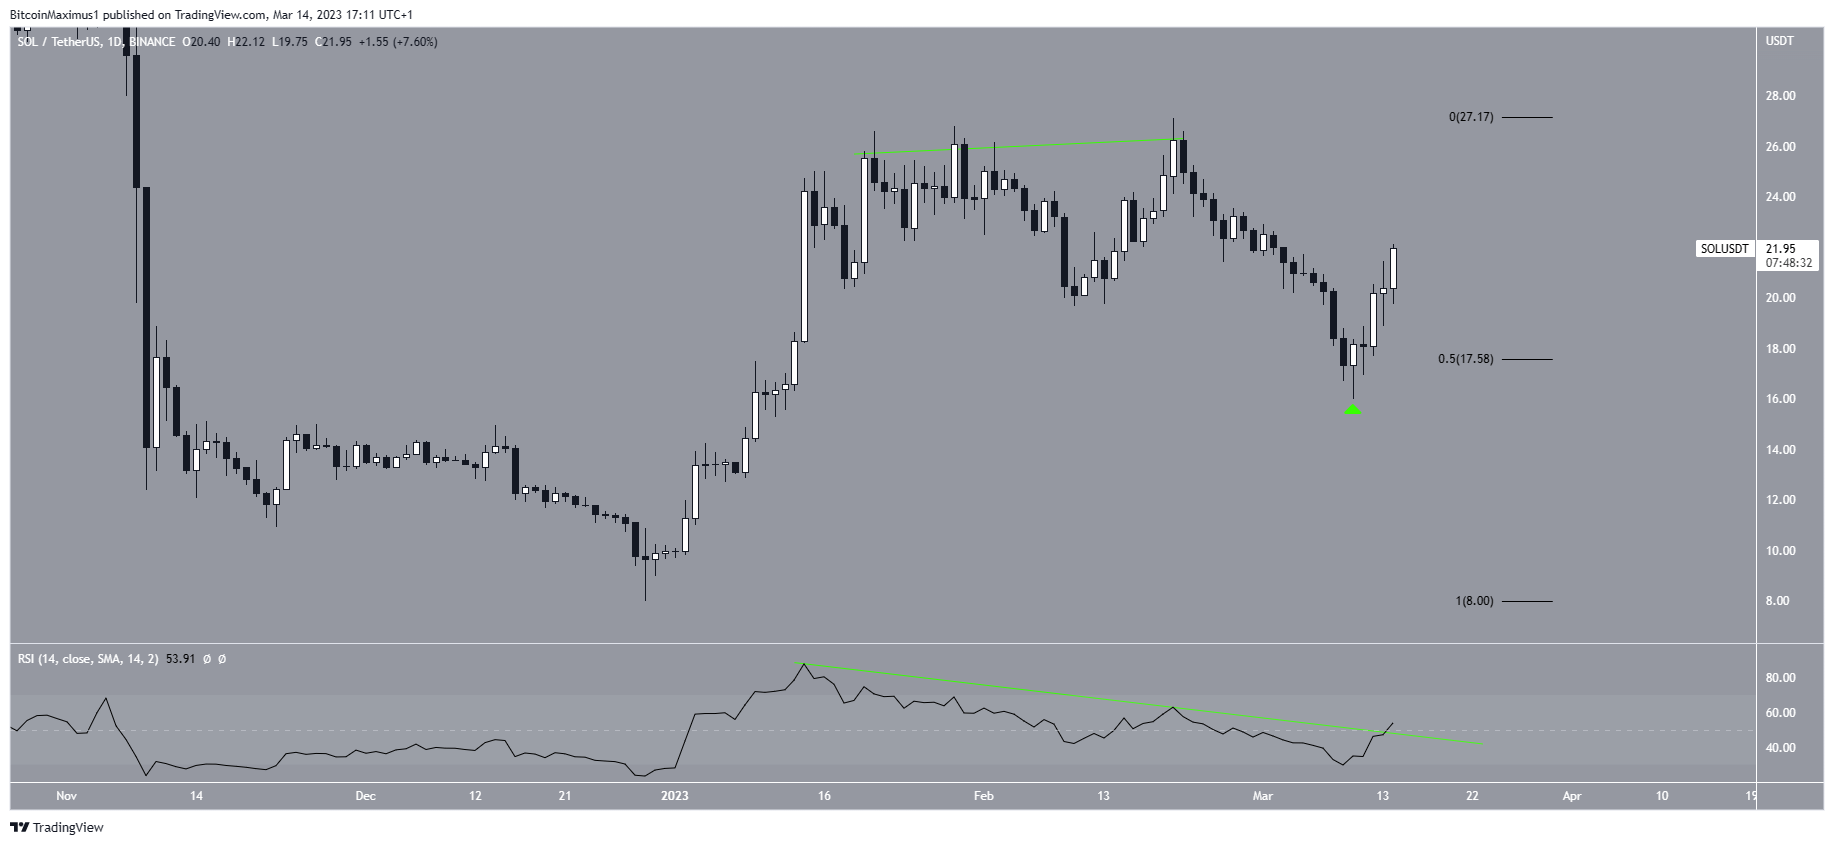
The technical analysis from the daily time frame shows that the SOL token price began a downward movement on Feb. 20. The decrease was preceded by bearish divergence in the daily RSI (green line) and led to a low of $16 on March 10.
However, the price bounced at the 0.5 Fib retracement support level, validating it as support. It has been increasing since.
Interestingly, the daily RSI is in the process of breaking out from the bearish divergence trend line and moving above 50. Both of these are considered signs of bullish trends.
As a result, it seems likely that the SOL price will increase to the aforementioned resistance at $27.

SOL/USDT Daily Chart. Source: TradingView
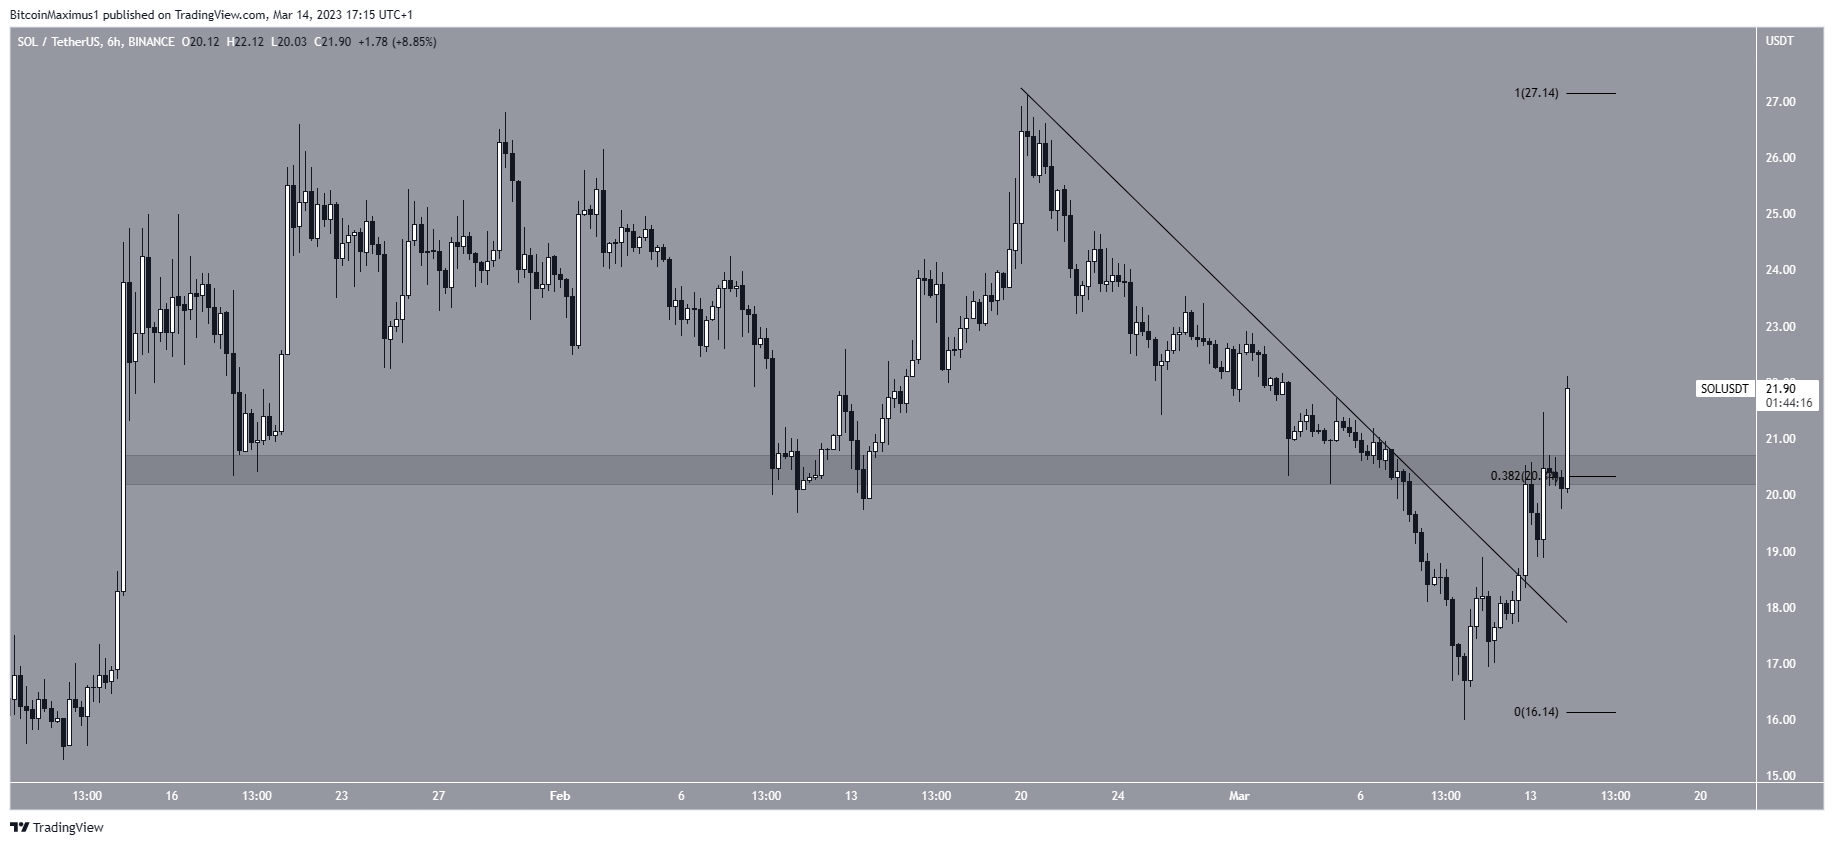
Finally, the short-term six-hour chart shows that the SOL price already broke out from a descending resistance line. Additionally, it moved above the minor $20.50 resistance, which is both a Fib and horizontal resistance area.
Therefore, these readings support the continuation of the increase toward $27. The reaction once it gets there will likely determine the future trend.
On the other hand, a close below $20.50 would invalidate the bullish structure. If that occurs, it could catalyze a fall to $17.60.

SOL/USDT Six-Hour Chart. Source: TradingView
To conclude, the most likely Solana price forecast is an increase to the $27 resistance area. It is still being determined if the price will break out.
A close below the $20.50 minor support area would invalidate this bullish forecast. In that case, the SOL price could again fall to the 0.5 Fib support at $17.60.
For BeInCrypto’s latest crypto market analysis, click here.


 Bitcoin
  Ethereum
  Tether
  USDC
USDC  TRON
TRON  Dogecoin
  Cardano
  Monero
  Bitcoin Cash
  Chainlink
  LEO Token
  Stellar
  Zcash
Zcash  Litecoin
  Hedera
  Dai
Dai  Cronos
  OKB
OKB  Tether Gold
  Ethereum Classic
  KuCoin
  Cosmos Hub
  Gate
Gate  Algorand
  VeChain
  Dash
Dash  Stacks
  Tezos
Tezos  TrueUSD
  IOTA
IOTA  Decred
  Theta Network
  Basic Attention
  NEO
NEO  Synthetix
  Qtum
Qtum  Ravencoin
  0x Protocol
  DigiByte
  Zilliqa
  Nano
Nano  Siacoin
  Numeraire
  Waves
Waves  Ontology
  Enjin Coin
  Status
  BUSD
BUSD  Hive
Hive  Pax Dollar
  Lisk
Lisk  Steem
Steem  Huobi
Huobi  OMG Network
  Bitcoin Gold
  NEM
NEM  Augur
Augur  Bitcoin Diamond