XRP Explodes 9% Weekly but Is a Correction Imminent? (Ripple Price Analysis)

Ripple’s price is finally showing some bullishness following 4 weeks of downward movement. However, there are still some concerning signs on the charts.
Technical Analysis
By: Edris
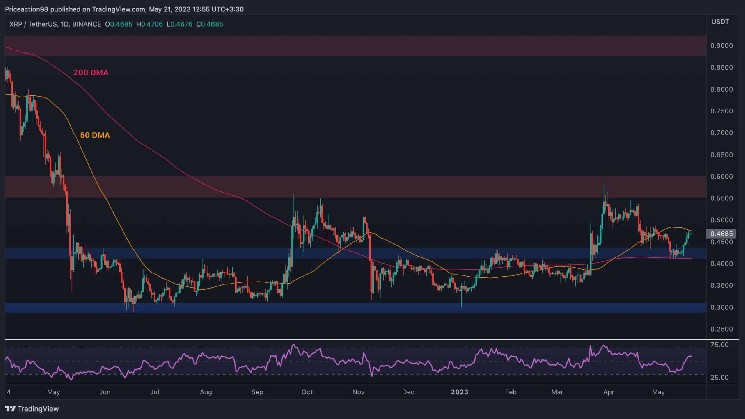
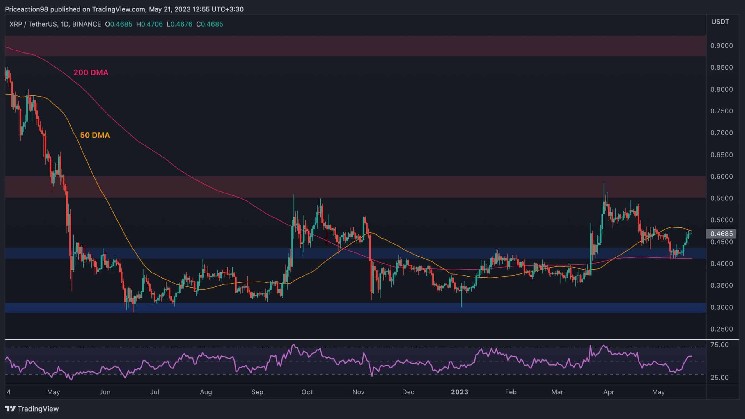
XRP/USDT Daily Chart
The price has rebounded from the $0.43 support level, with the key 200-day moving average located around the same level. Currently, the 50-day moving average is being tested around the $0.47 mark, but XRP has yet to break above.
If a bullish breakout were to occur, a rally toward the $0.6 resistance level would be the most probable scenario. On the other hand, a drop below the 200-day moving average would be disastrous, as a decline toward the $0.3 level and even lower would become more likely. This would likely prolong the bear market.
The RSI indicator has also risen above 50%, displaying bullish momentum at the moment.

XRP/BTC Daily Chart
Against BTC, XRP has finally broken out of the large descending channel after more than 6 months. The price has surged above the 50-day moving average located around the 0.000017 mark and is currently attacking the 0.000018 resistance level.
The 200-day moving average trending around the 0.000019 price point could be the next target in case the price breaks through the 0.000018 level. On the other hand, a drop back inside the channel could lead to a crash toward the 0.000013 level.
Judging by the momentum signal by RSI, the bullish scenario seems more likely.


 Bitcoin
  Ethereum
  Tether
  USDC
USDC  TRON
TRON  Dogecoin
  Cardano
  Monero
  Bitcoin Cash
  Chainlink
  LEO Token
  Stellar
  Zcash
Zcash  Litecoin
  Hedera
  Dai
Dai  Cronos
  OKB
OKB  Tether Gold
  Ethereum Classic
  KuCoin
  Cosmos Hub
  Gate
Gate  Algorand
  VeChain
  Dash
Dash  Stacks
  Tezos
Tezos  TrueUSD
  IOTA
IOTA  Decred
  Theta Network
  Basic Attention
  NEO
NEO  Synthetix
  Qtum
Qtum  Ravencoin
  0x Protocol
  DigiByte
  Zilliqa
  Nano
Nano  Siacoin
  Numeraire
  Waves
Waves  Ontology
  Status
  Enjin Coin
  Hive
Hive  BUSD
BUSD  Pax Dollar
  Lisk
Lisk  Steem
Steem  Huobi
Huobi  OMG Network
  Bitcoin Gold
  NEM
NEM  Augur
Augur  Bitcoin Diamond