Cardano price analysis: ADA ready to take off after stabilising around $0.50

Cardano price analysis is expected to turn bullish once again, as price can be seen consolidating above the $0.50 support zone. ADA price rose more than 3 percent over the past 24 hours to move as high as $0.52. Cardano is expected to form a similar pattern as seen last month which could entice buyers for an easy setup to capitalize on.
This pattern was first seen on June 13, 2022 at a low of $0.435, which was followed up by a 25 percent uptrend to $0.550 in the next week. Cardano price recorded a similar downtrend to $0.488 over the past few days, and price could be ready to form a rally soon. ADA could rise a further 8 percent from the current price at $0.51 before exhausting the uptrend.
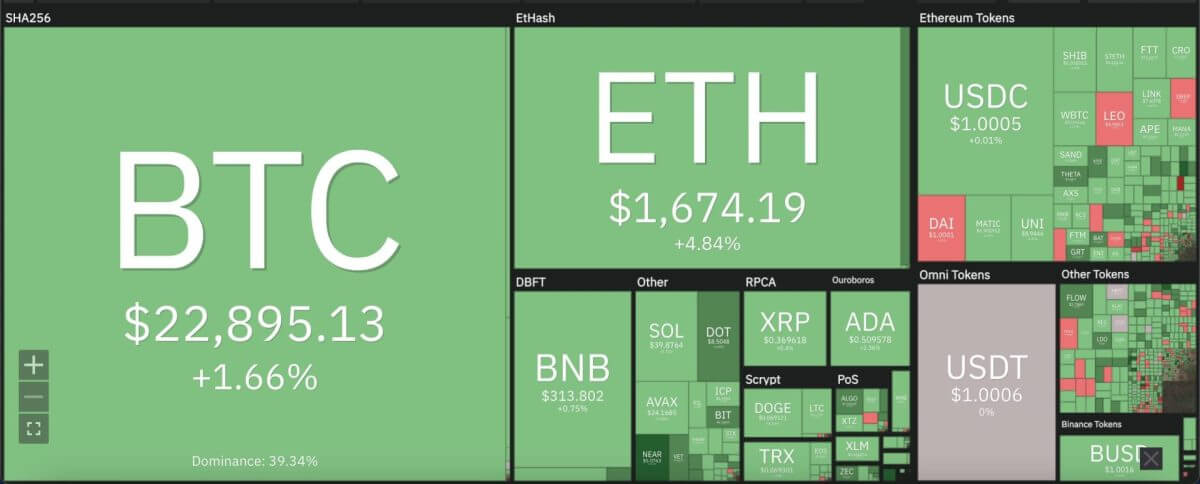
The larger cryptocurrency market showed positive signs over the past 24 hours, as Bitcoin made a 2 percent jump to move into touching distance of the $23,000 mark. Ethereum rose 5 percent to move up to $1,700, while major Altcoins also showed similar uptrends. Ripple rose up to $0.37 while Dogecoin ascended 4 percent to rise up to $0.07. Solana and Polkadot made bigger strides than most cryptocurrencies over the past 24 hours, with the former rising 5 percent up to $39.87, and the latter soaring up 7 percent to move as high as $8.50.

Cardano price analysis: Cryptocurrency heat map. Source: Coin360
Cardano price analysis: 24-hour RSI shows increasing market valuation for ADA
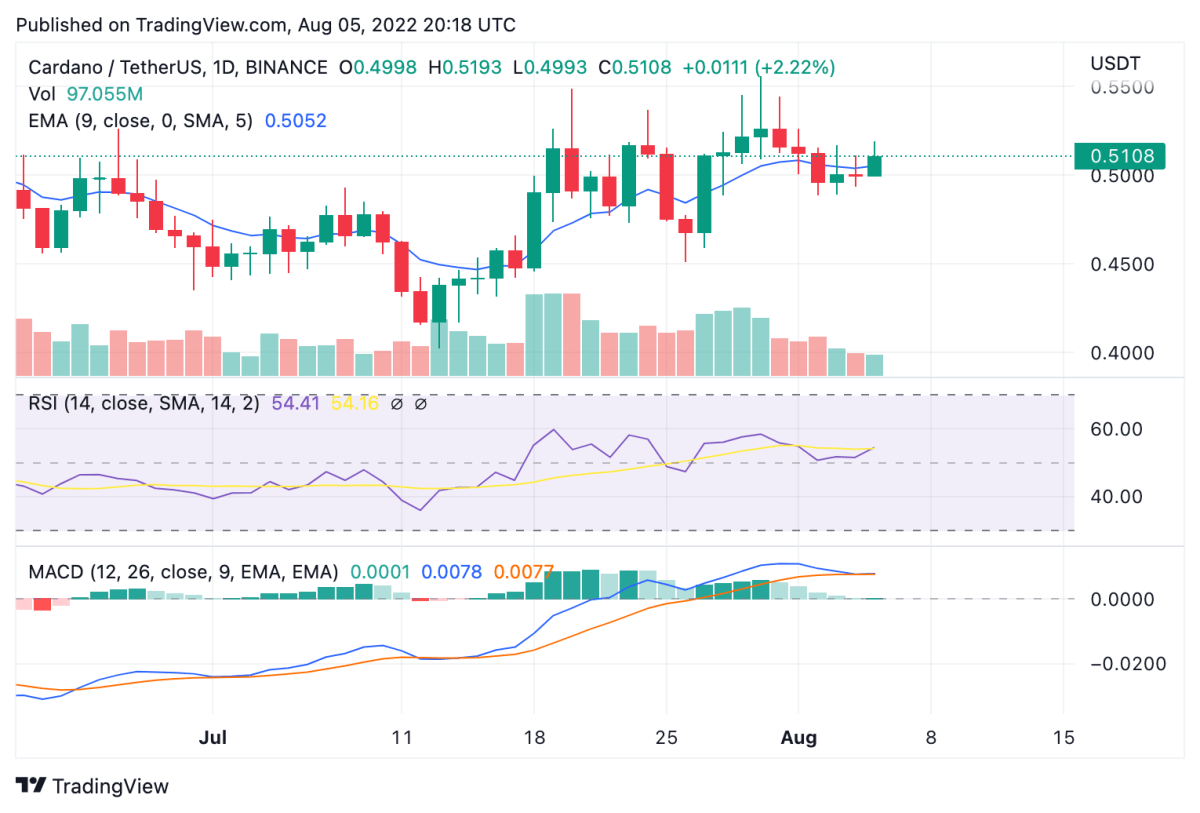
On the 24-hour candlestick chart for Cardano price analysis, price can be seen attempting to rise above the $0.50 support region after surpassing seller pressure over the past week. ADA looked to be heading downwards beyond second support channel at $0.45 before withstanding bearish pressure around current price at $0.51. Cardano price has crucially remained in touch with the 9 and 21-day moving averages, along with the crucial 50-day exponential moving average (EMA) at $0.504.

Cardano price analysis: 24-hour chart. Source: Trading View
The 24-hour relative strength index (RSI) has also moved up to above 50 over the past 24 hours, representing healthy market valuation for ADA. Price could be tested further as the RSI approaches the over bought region above 60. Meanwhile, the moving average convergence divergence (MACD) curve remains unchanged from yesterday and shows a potential bearish divergence in place on the daily chart. A daily close below $0.45 would invalidate the bullish thesis for ADA with price also potentially visiting the next support level at $0.38 in such a scenario.
Disclaimer. The information provided is not trading advice. Cryptopolitan.com holds no liability for any investments made based on the information provided on this page. We strongly recommend independent research and/or consultation with a qualified professional before making any investment decisions.


 Bitcoin
  Ethereum
  Tether
  USDC
USDC  TRON
TRON  Dogecoin
  Cardano
  Bitcoin Cash
  Chainlink
  Monero
  LEO Token
  Stellar
  Zcash
Zcash  Litecoin
  Hedera
  Dai
Dai  Cronos
  Tether Gold
  OKB
OKB  Ethereum Classic
  KuCoin
  Gate
Gate  Algorand
  Cosmos Hub
  VeChain
  TrueUSD
  Dash
Dash  Tezos
Tezos  Stacks
  IOTA
IOTA  Basic Attention
  Theta Network
  Decred
  NEO
NEO  Synthetix
  Qtum
Qtum  Ravencoin
  0x Protocol
  DigiByte
  Nano
Nano  Zilliqa
  Holo
Holo  Siacoin
  Numeraire
  Waves
Waves  BUSD
BUSD  Status
  Enjin Coin
  Pax Dollar
  Ontology
  Hive
Hive  Lisk
Lisk  Steem
Steem  Huobi
Huobi  OMG Network
  NEM
NEM  Bitcoin Gold
  Augur
Augur  Ren
Ren  HUSD
HUSD