Bitcoin Cash (BCH) Makes Another Attempt to Breach $166 Mark!

Bitcoin Cash is an improved, advanced, and more capable blockchain than its parent BTC. BCH’s last released block size was 32 MB, while BTC was just 1 MB. This indicates the difficulty level in solving a BCH-based block. With the news of mining operations slowly shifting towards Proof of Stake, miners have increasingly inclined to shift towards Proof of Work blockchains, making BCH an ideal candidate.
BTC is undoubtedly the crypto-king, but the time required to mine a block on BTC is too high, and larger numbers of miners have further made their operations more competitive. BCH currently ranks at 29th position with a market capitalization of $2.5 billion, with close to 91% of its entire supply already in circulation in the market. Hence, the prospect of higher block rewards and increasing value of the BCH token couldn’t be a far-fetched story.
BCH has brought back its days of a positive outlook. The technical outlook shows a sudden rise in buying activity; could this be a result of shifting to mining-based blockchains? Click here to know about it.

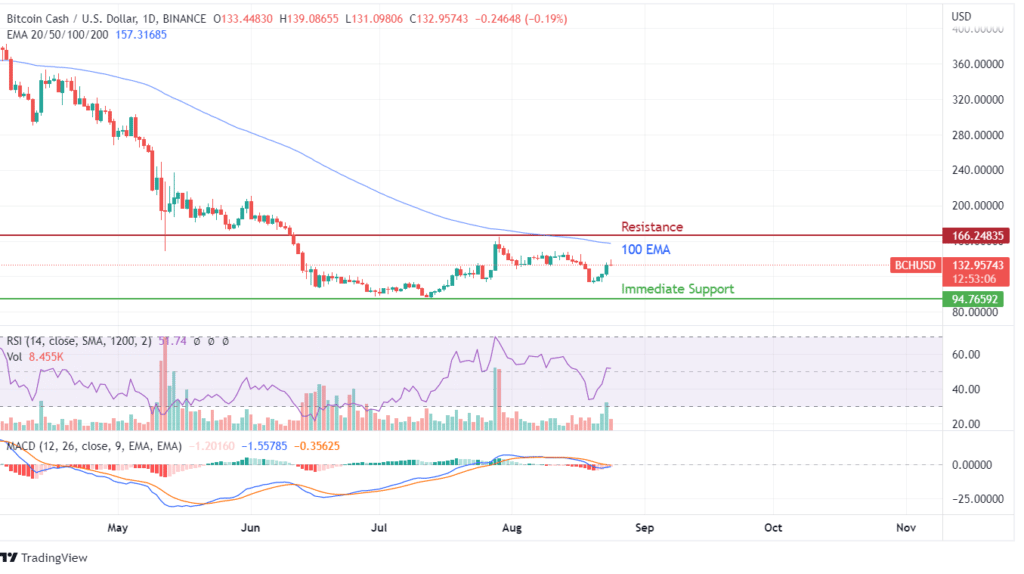
Bitcoin Cash’s price action is similar to Bitcoin, with the only difference of BTC copying BCH’s price action. Short term outlook for the BCH token has showcased a small potential to continue moving towards the 100 EMA curve and mark the positive breakout as a pivot point. The historical price action-based resistance is active at the $166 level, which remains quite lower than its historical highs of $1542 reached in May 2021.
The Bitcoin Cash’s probability of retesting this high remains out of grasp considering current developments of Bitcoin Cash, but the outlook is slightly positive. RSI indicator has jumped from near oversold zones to above 45, indicating higher buying action, while the MACD indicator is on track to create a bullish crossover and confirm the positive outlook.
Weekly charts of Bitcoin Cash showcase a neutral stance considering the last week’s red candle, but the formation of two back-to-back green candles strengthens its outlook. On the other hand, the monthly chart is still in a negative outlook as week-on-week price action has failed to continue with a positive stance or hit higher highs.


 Bitcoin
  Ethereum
  Tether
  USDC
USDC  TRON
TRON  Dogecoin
  Cardano
  Bitcoin Cash
  Chainlink
  LEO Token
  Zcash
Zcash  Monero
  Stellar
  Litecoin
  Hedera
  Dai
Dai  Cronos
  OKB
OKB  Tether Gold
  Ethereum Classic
  KuCoin
  Gate
Gate  Algorand
  Cosmos Hub
  VeChain
  Tezos
Tezos  Dash
Dash  TrueUSD
  Stacks
  IOTA
IOTA  Basic Attention
  Decred
  Theta Network
  NEO
NEO  Qtum
Qtum  Synthetix
  0x Protocol
  Ravencoin
  DigiByte
  Zilliqa
  Nano
Nano  Holo
Holo  Siacoin
  Numeraire
  Waves
Waves  Ontology
  BUSD
BUSD  Status
  Enjin Coin
  Hive
Hive  Pax Dollar
  Lisk
Lisk  Steem
Steem  Huobi
Huobi  OMG Network
  NEM
NEM  Bitcoin Gold
  Augur
Augur