Polkadot Drops Significantly as It Can Hold above $5.98 Support

The price of Polkadot (DOT) is in a downtrend and has fallen to the lower price level of $5.98. This support is the historical price level from July 13 and has not been broken yet.
Long-term analysis of the Polkadot price: bearish
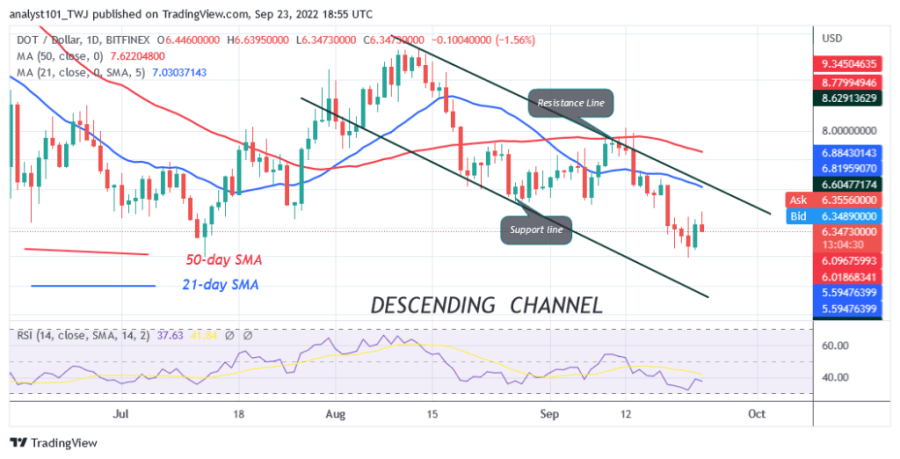
The cryptocurrency has fallen into the oversold zone of the market. Further downward movement of prices is unlikely. If the sellers break the $6.00 support, the altcoin will fall to a low of $4.00. However, Polkadot will resume its uptrend if the current support holds. On July 13, the cryptocurrency rallied from the $5.98 support and reached the high of $9.64 on August 10. Today, Polkadot is trading at $6.29 at the time of writing.
Analysis of Polkadot indicators
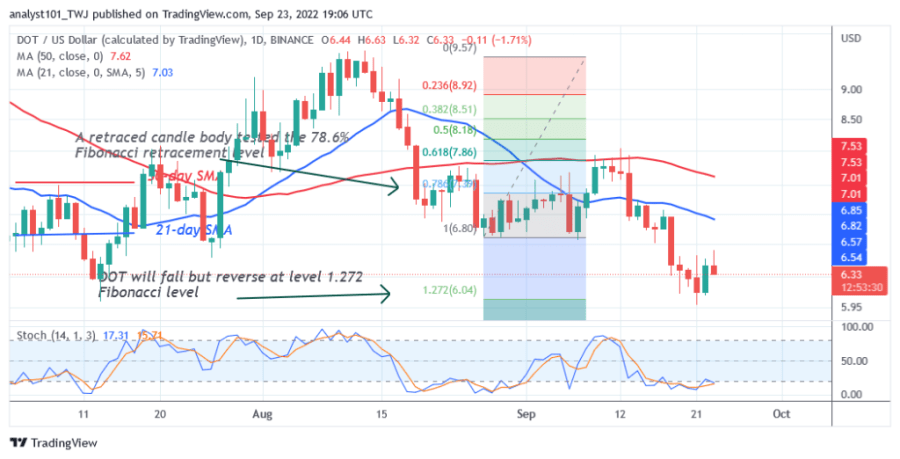
Polkadot is at level 36 of the Relative Strength Index for the period 14. DOT The price is in the downward zone, as buyers appear in the oversold region. DOT Polkadot’s price bars have fallen well below the moving average lines, indicating a further decline in the altcoin. The cryptocurrency is below the 20% range of the daily stochastic. This confirms that the market has reached the oversold zone.

Technical Indicators
Key resistance zones: $10, $12, $14
Major support zones: $8.00, $6.00, $4.00
What is the next direction for Polkadot?
Polkadot has retraced to the previous low of July 13. The downtrend has reached its bearish exhaustion. Meanwhile, the downtrend tested the 78.6% Fibonacci retracement level through a candlestick on August 27. The retracement suggests that DOT will fall but will reverse at the Fibonacci level of 1.272 or $6.04. Based on the price action, the market has fallen to the low of $6.31 at the time of writing.

Disclaimer. This analysis and forecast are the personal opinions of the author and are not a recommendation to buy or sell cryptocurrency and should not be viewed as an endorsement by CoinIdol. Readers should do their research before investing in funds.


 Bitcoin
  Ethereum
  Tether
  USDC
USDC  TRON
TRON  Dogecoin
  Cardano
  Bitcoin Cash
  Chainlink
  Zcash
Zcash  LEO Token
  Monero
  Stellar
  Litecoin
  Hedera
  Dai
Dai  Cronos
  OKB
OKB  Tether Gold
  Ethereum Classic
  KuCoin
  Gate
Gate  Algorand
  Cosmos Hub
  VeChain
  Tezos
Tezos  Dash
Dash  TrueUSD
  Stacks
  IOTA
IOTA  Basic Attention
  Decred
  Theta Network
  NEO
NEO  Qtum
Qtum  Synthetix
  0x Protocol
  Ravencoin
  DigiByte
  Zilliqa
  Nano
Nano  Siacoin
  Numeraire
  Waves
Waves  Ontology
  BUSD
BUSD  Status
  Enjin Coin
  Hive
Hive  Pax Dollar
  Lisk
Lisk  Steem
Steem  Huobi
Huobi  OMG Network
  NEM
NEM  Bitcoin Gold
  Augur
Augur