


Cosmos Price Prediction: Will ATOM Escape Declining Streak?

- Cosmos was currently at $10.73, which decreased by 4.92% during the intraday trading session.
- The 24-hour low of ATOM was $10.61 and the 24-hour high of ATOM was $11.38.
- The current Cosmos token price is below 20, 50, 100, and 200-Day EMA.
The pair of ATOM/BTC was trading at 0.0005152 BTC with a rise of 0.47% over the intraday trading session.
Cosmos price analysis suggests that it is currently in a downtrend. After the start of 2022, the token was in a steep decline as can be seen on the daily trading chart till June 2022. This indicates that the sellers have been dominating since the start of 2022 which caused the token value to fall below its secondary support and entered its demand zone or accumulation phase. Because of the seller’s heavy pressure in May 2022, the token made its new 52-week low. After that buyers pushed the token upwards even reaching its secondary resistance of $15.505. But after November 2022 sellers took back the market from buyers pushing the token below its primary support and kept it there till the end of the year.
After the start of 2023, the token again started moving upwards breaking its primary support and resistance. But after touching the secondary resistance the token sellers became active in the market pushing the token below its primary support.
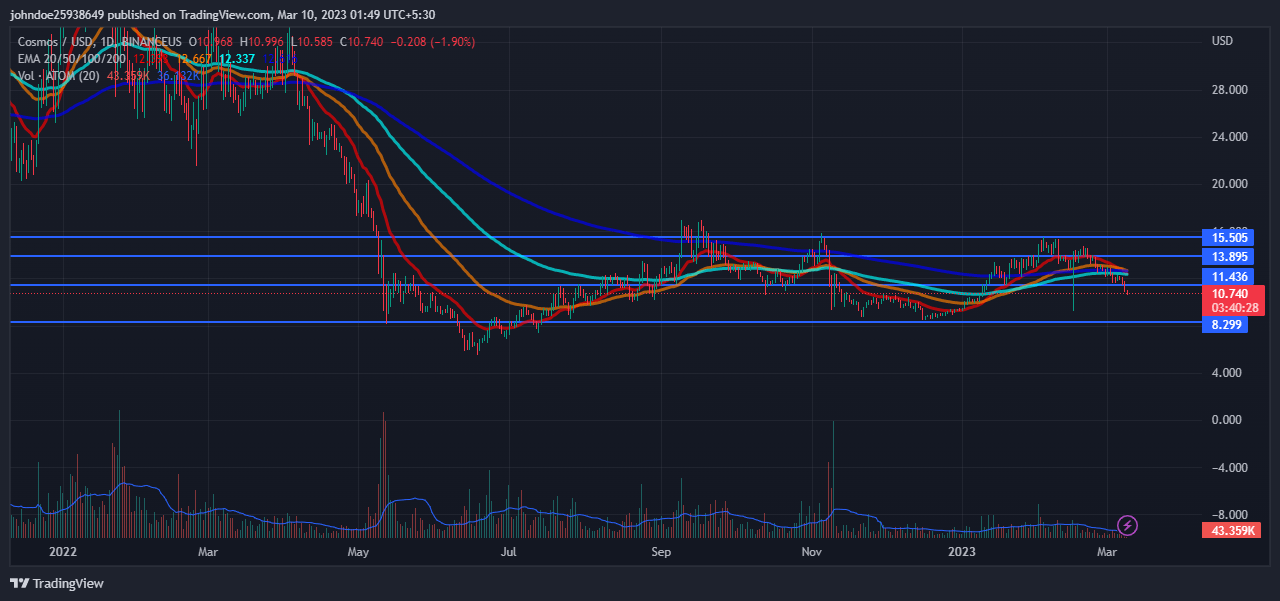
Source: ATOM/USD by Tradingview
The volume of the coin has increased by 91.09% in the last 24 hours. The increase in volume indicates that the number of buyers has increased. This shows that buyers are trying their best and there is no relationship between volume and the price of ATOM, which represents a weakness in the current bearish phase and a possible reversal.
Cosmos Price Technical analysis:
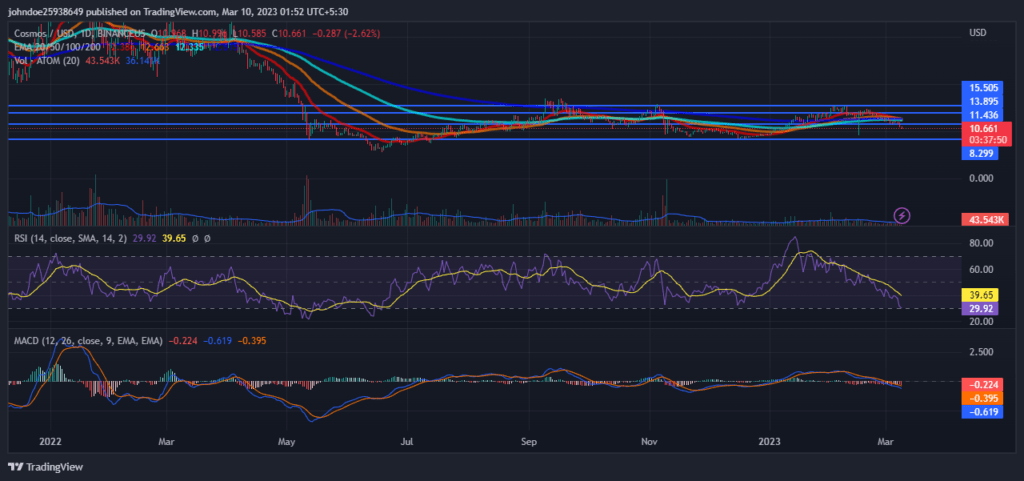
Source: ATOM/USD by Tradingview
RSI is decreasing in the oversold zone and is showing a negative crossover which indicates that the sellers are coming in the majority and pushing ATOM downwards. This suggests the strength of the current bearish trend. The current value of RSI is 29.87 which is below the average RSI value of 39.65.
The MACD and the signal line are decreasing but not showing any definitive crossover over the daily chart which can support the RSI claims. Investors need to watch every move over the charts during the day’s trading session.
Conclusion
Cosmos price analysis suggests that it is currently in a downtrend. After the start of 2022, the token was in a steep decline as can be seen on the daily trading chart till June 2022. After the start of 2023, the token again started moving upwards breaking its primary support and resistance. The increase in volume shows the positive market sentiment towards the token. After the start of 2023, the token again started moving upwards breaking its primary support and resistance which shows strength in the current bearish trend, as per the technical indicators.
Technical Levels-
Resistance level- $13.895 and $15.505
Support level- $11.436 and $8.299
Disclaimer-
The views and opinions stated by the author, or any people named in this article, are for informational purposes only, and they do not establish financial, investment, or other advice. Investing in or trading crypto assets comes with a risk of financial loss.


 Bitcoin
  Ethereum
  Tether
  USDC
USDC  Dogecoin
  Cardano
  Bitcoin Cash
  Polygon
  Litecoin
  LEO Token
  Hedera
  Stellar
  Cosmos Hub
  OKB
OKB  Maker
Maker  Algorand
  NEO
NEO  Gate
Gate  KuCoin
  Synthetix Network
  IOTA
IOTA  Tether Gold
  TrueUSD
  Enjin Coin
  Holo
Holo  Ravencoin
  0x Protocol
  Siacoin
  Basic Attention
  Ontology
  Zcash
Zcash  Decred
  Lisk
Lisk  Waves
Waves  DigiByte
  Status
  Numeraire
  Nano
Nano  Pax Dollar
  Steem
Steem  OMG Network
  BUSD
BUSD  Ren
Ren  Bytom
Bytom  Bitcoin Diamond
  HUSD
HUSD  Energi
  Augur
Augur