


Aave price analysis: Bearish spell degrades AAVE price to $99.23

Aave price analysis indicates that the AAVE/USD pair is bearish today. After a period of consolidation above the $100 level, the price has started to dip and is currently trading at $99.23. The bears have taken control of the market and are likely to push the price lower in the near term. The main support level for the AAVE/USD pair is present at $98.88. If the price breaks below this level, it could fall to $97.55 in the short term.
Resistance for AAVE/USD is present at $108.48. If the price break above this level, it could start an uptrend and rise to $110.50 in the near term. The AAVE/USD is down by 8.50% in the last 24 hours. The market sentiment is bearish and the price could continue to fall in the near term. The market cap of the coin is $1.39 billion and the 24-hour trading volume is $200 million.
AAVE/USD 1-day price chart: Aave continues downside after facing rejection at $108.48
The daily timeframe shows that the Aave price analysis has been in a downtrend for the past few hours. The Bulls tried to push the price higher yesterday, but they failed to break above the $108.48 resistance level. The bears quickly took control of the market and pushed the price lower.
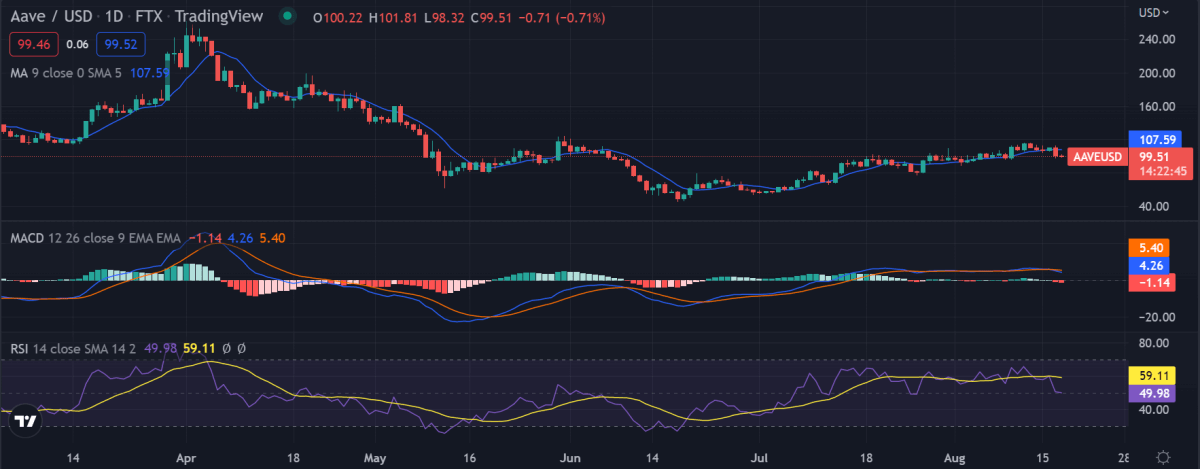
AAVE/USD 1-day price chart, Source: TradingView
The Relative Strength Index (RSI) is currently at 41.64, indicating that the market is in bearish territory. The MACD is also in bearish territory and is likely to generate a sell signal in the near term. The 50-day moving average (MA) is at $105.44 and the 200-day MA is at $112.18. These levels are likely to act as strong resistance levels in the near term.
AAVE/USD 4-hour price chart: Recent updates
The hourly timeframe shows that the Aave price analysis is in a downtrend. The price has been making lower highs and lower lows, indicating that the bears are in control of the market. The market is volatile and the price could move in either direction in the near term. The Pair has been trading between the $98.88 and $108.48 levels for the past few hours and a breakout is likely in the near term.
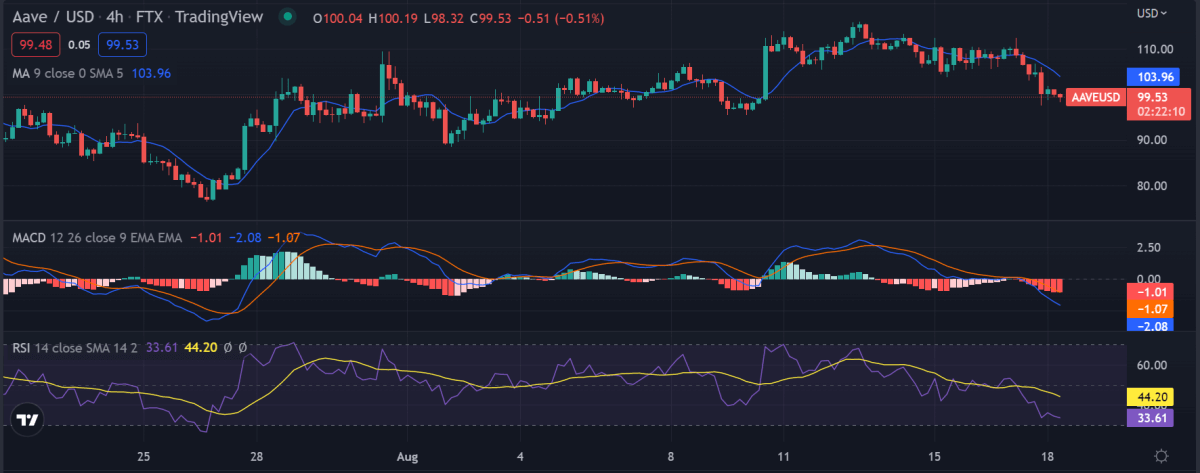
AAVE/USD 4-hour price chart, source: TradingView
The MACD indicator is likely to move into bullish territory in the near term. The RSI is currently at 48.29 and is likely to fall further in the near term. The Relative Strength Index (RSI) is also below the 50 levels, indicating that the market is in bearish territory. The 50-day MA and the 200-day MA are both moving lower and are likely to act as strong resistance levels in the near term.
Aave Price Analysis: Conclusion
The price experienced a drop today, as confirmed by the one-day and four-hour Aave price analysis. Although the price went higher at the start of the trading session, following yesterday’s bearish trend, the bears are now back on track as they have been able to bring the price down to the $99 level in the last few hours. The cryptocurrency is to face more loss in the future as the hourly prediction has been on the unfavorable side as well.
Disclaimer. The information provided is not trading advice. Cryptopolitan.com holds no liability for any investments made based on the information provided on this page. We strongly recommend independent research and/or consultation with a qualified professional before making any investment decisions.


 Bitcoin
  Ethereum
  Tether
  USDC
USDC  Dogecoin
  Cardano
  Bitcoin Cash
  Litecoin
  Polygon
  LEO Token
  Hedera
  Stellar
  Cosmos Hub
  OKB
OKB  Maker
Maker  Algorand
  NEO
NEO  Gate
Gate  KuCoin
  Synthetix Network
  IOTA
IOTA  Tether Gold
  TrueUSD
  Enjin Coin
  Ravencoin
  Holo
Holo  0x Protocol
  Siacoin
  Basic Attention
  Zcash
Zcash  Ontology
  Decred
  Lisk
Lisk  Waves
Waves  DigiByte
  Status
  Numeraire
  Nano
Nano  Pax Dollar
  Steem
Steem  OMG Network
  BUSD
BUSD  Ren
Ren  Bytom
Bytom  Bitcoin Diamond
  HUSD
HUSD  Energi
  Augur
Augur