


Algorand (ALGO) Price Risks 25% Drop Following Bearish Breakout

Algorand price created a bullish candlestick on Oct. 13, but this was not sufficient in initiating a bullish reversal. A breakdown from the current pattern is still expected.
ALGO has been increasing inside an ascending parallel channel since falling to a yearly low of $0.275 on June 18. ALGO price made a breakout attempt on Sept. 23 but was rejected by the resistance line of the channel (red circle).
The rejection and ensuing downward price movement were crucial since it both validated the resistance line of the channel and confirmed the deviation above the $0.373 resistance area.
While ALGO bounced on Oct. 13, it is still trading in the lower portion of the price channel. So, a breakdown is the most likely scenario.
This is also supported by the daily RSI, which has fallen below 50 (red icon).
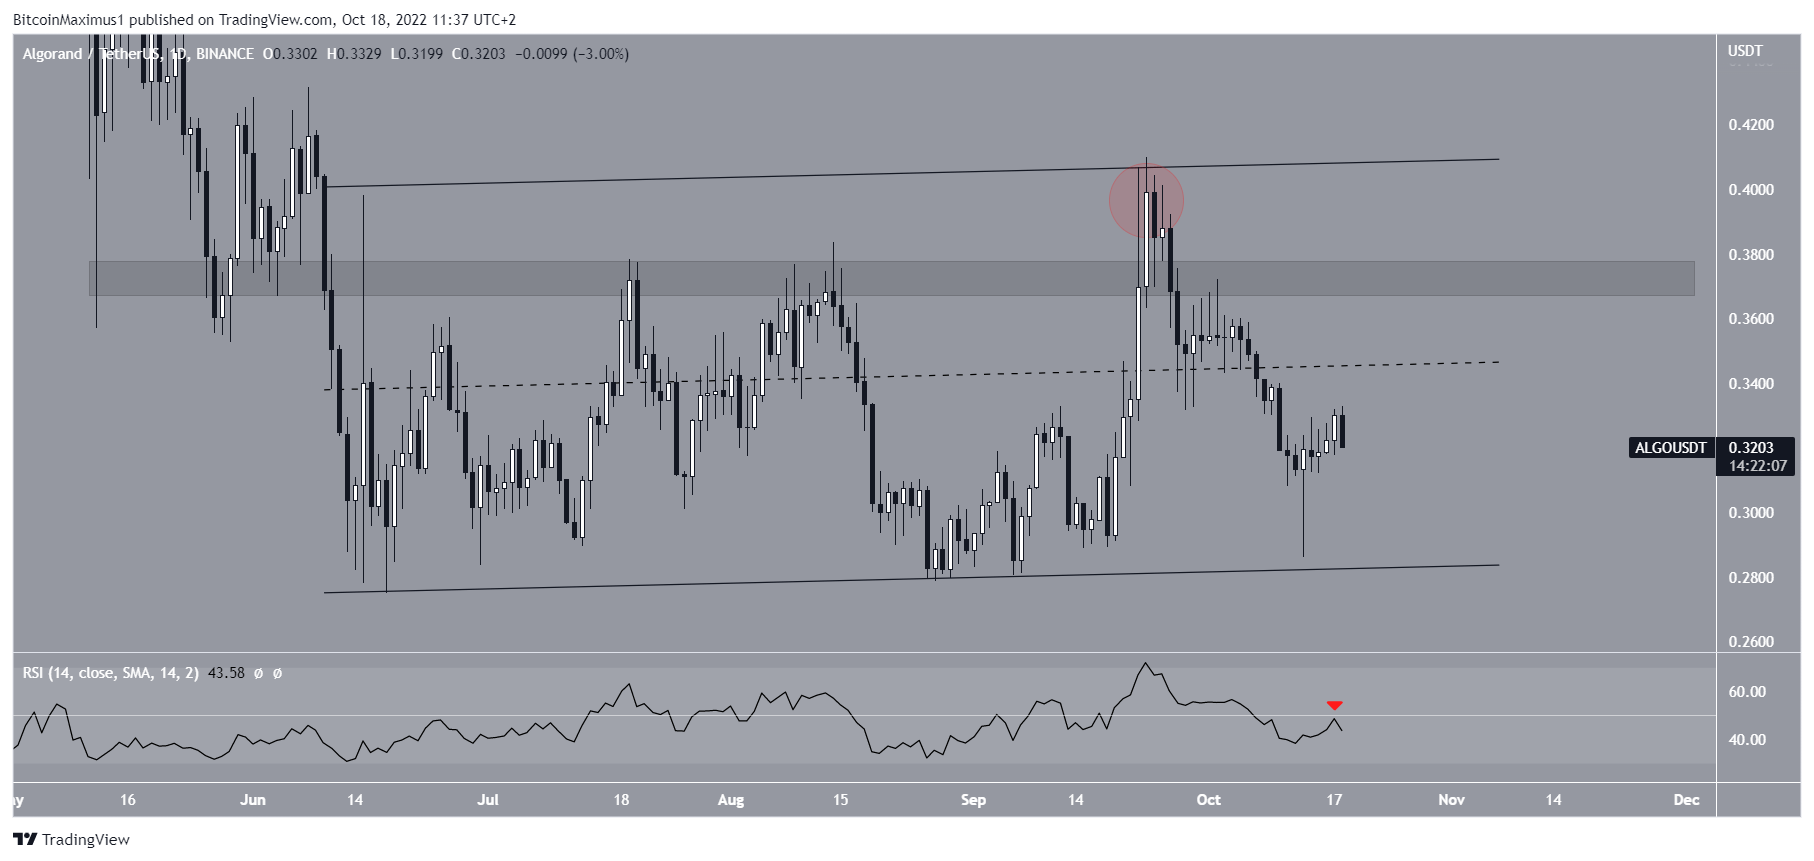
ALGO/USDT Chart By TradingView
ALGO price could fall to $0.24
The weekly chart shows that the main support area for ALGO is at $0.240. This is a crucial horizontal price support level that has not been reached since Nov. 2020.
It is important to note that the aforementioned yearly low of $0.275 has not been made at a Fib nor horizontal support level. So, it seems unlikely that a bullish price reversal could be sustained from that level.
As a result, a downward price movement towards the $0.24 area prior to a reversal seems to be the most likely scenario for Algorand. This is also in alignment with the bearish readings from the daily chart.
If the ALGO price fall to $0.24, it would potentially create the third touch of bullish divergence (green line) in the weekly RSI. This would confirm the divergence. Also, it could confirm the long-term bullish reversal.
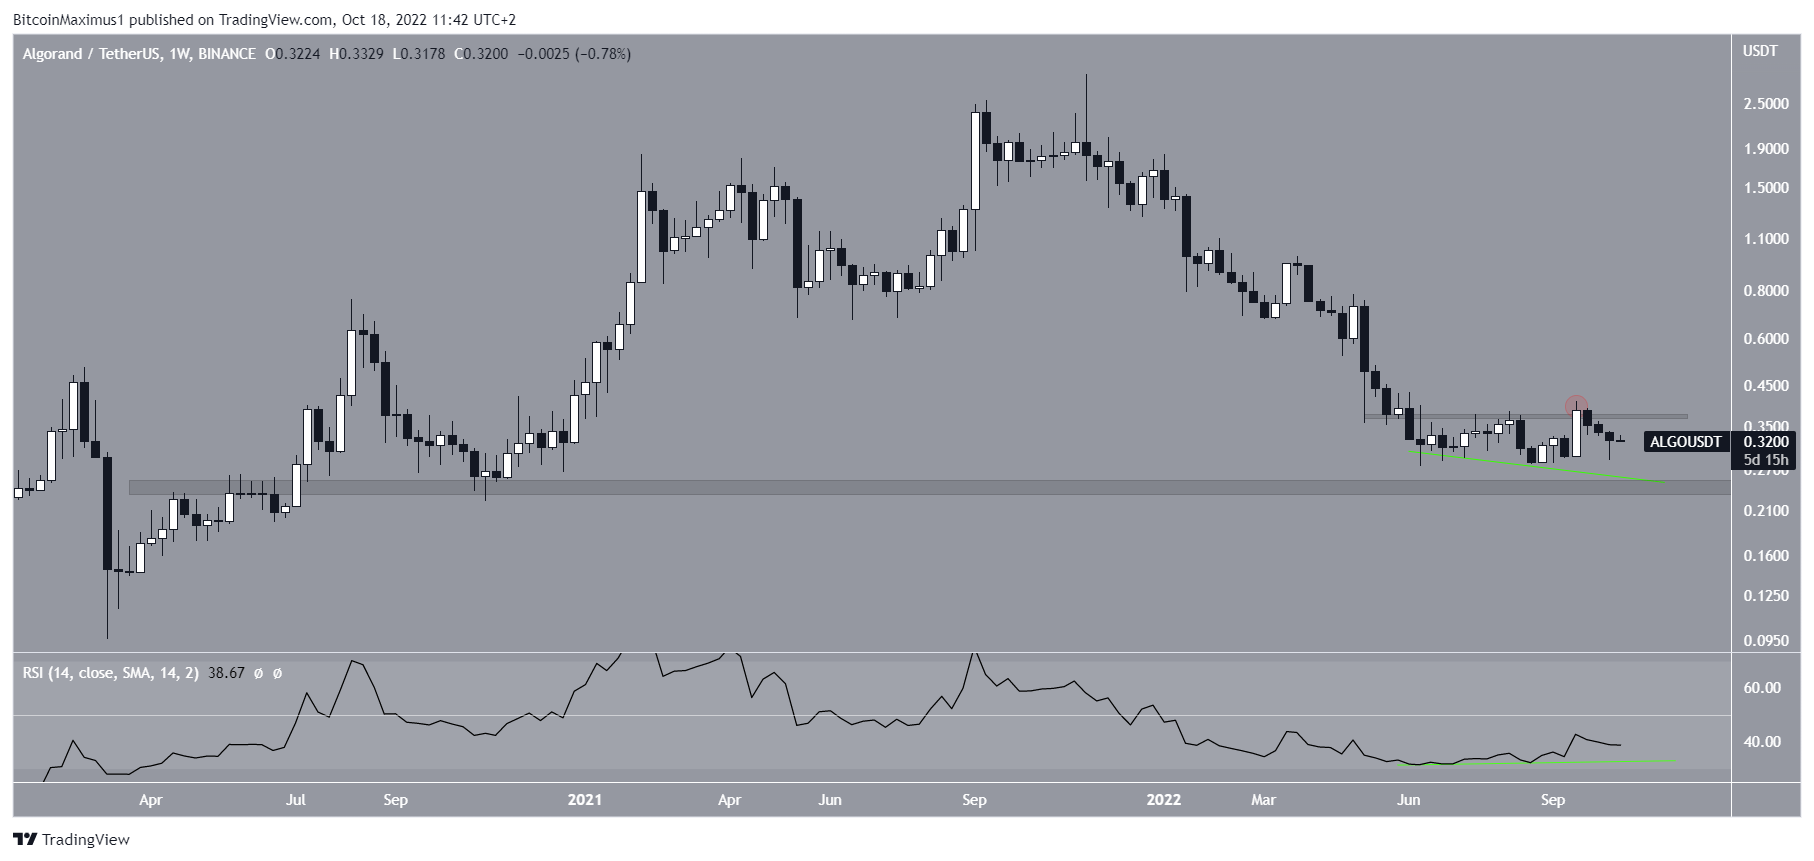
ALGO/USDT Chart By TradingView
Relief prior to price breakdown
To conclude, both the weekly and daily charts give a bearish price prediction. They indicate that the ALGO has yet to reach a bottom. Once it breaks down from the current pattern, a 25% decrease in price is predicted.
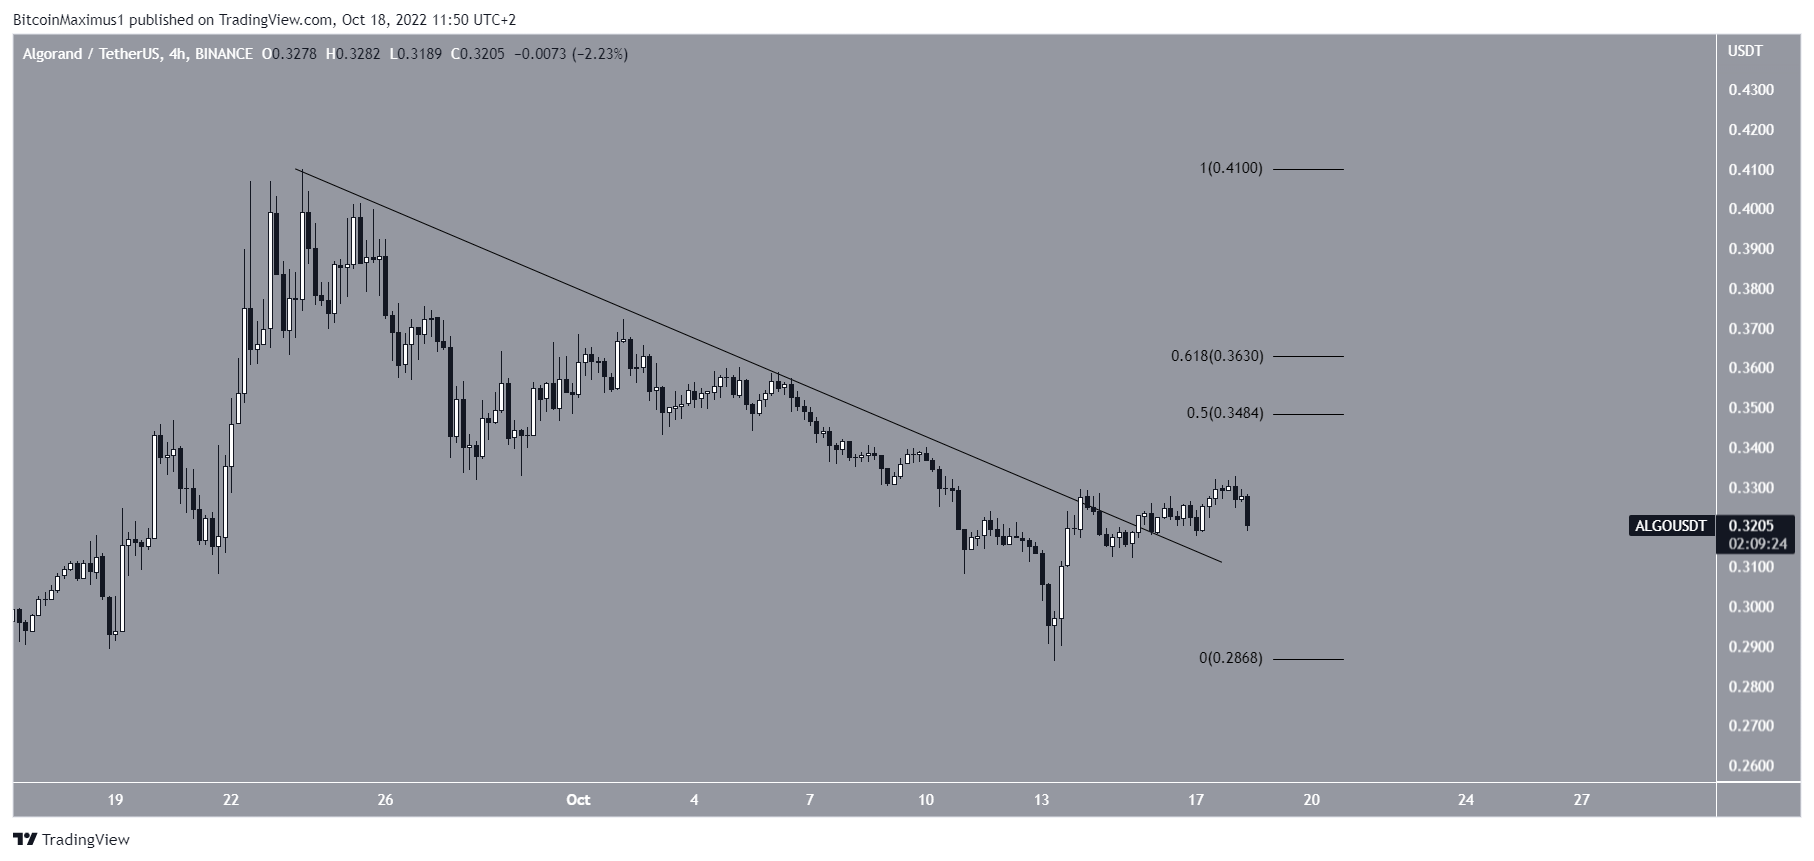
ALGO/USDT Chart By TradingView
The short-term chart provides some possibility for relief. It shows that ALGO has broken out from a descending resistance line. However, once the Algorand price reaches the $0.348-$0.363 resistance, the resumption of the downward movement is likely.
For BeInCrypto latest Bitcoin (BTC) analysis and crypto market analysis, click here
Disclaimer: BeInCrypto strives to provide accurate and up-to-date information, but it will not be responsible for any missing facts or inaccurate information. You comply and understand that you should use any of this information at your own risk. Cryptocurrencies are highly volatile financial assets, so research and make your own financial decisions.


 Bitcoin
  Ethereum
  Tether
  USDC
USDC  Dogecoin
  Cardano
  Bitcoin Cash
  Polygon
  Litecoin
  LEO Token
  Hedera
  Cosmos Hub
  Stellar
  OKB
OKB  Maker
Maker  Algorand
  NEO
NEO  Gate
Gate  KuCoin
  Synthetix Network
  IOTA
IOTA  Tether Gold
  TrueUSD
  Enjin Coin
  Holo
Holo  Ravencoin
  0x Protocol
  Siacoin
  Basic Attention
  Zcash
Zcash  Ontology
  Decred
  Lisk
Lisk  Waves
Waves  DigiByte
  Status
  Pax Dollar
  Numeraire
  Nano
Nano  Steem
Steem  OMG Network
  BUSD
BUSD  Ren
Ren  Bitcoin Diamond
  Bytom
Bytom  HUSD
HUSD  Energi
  Augur
Augur