Arpa Price Prediction: ARA Price Rises 118% in 4 Days

- 1 Arpa’s price is currently trading at $0.10618 while witnessing a decrease of -7.05% during the intraday session.
- 2 Arpa price is trading above the 20,50,100, and 200-day EMAs.
- 3 The year-to-date return of ARPA is 302.75%.
Arpa chain is a computation network that enables privacy-preserving smart contracts, data storage, and scalable off-chain transactions. Arpa is the Ethereum coin that powers the Arpa chain.
The token serves existential functions, such as all the multi-party computation members being reimbursed with ARPA tokens for their contribution of computing power. It is also used in data and model usage fees. Token holders with more than a certain amount can vote on suggestions using the tokens.
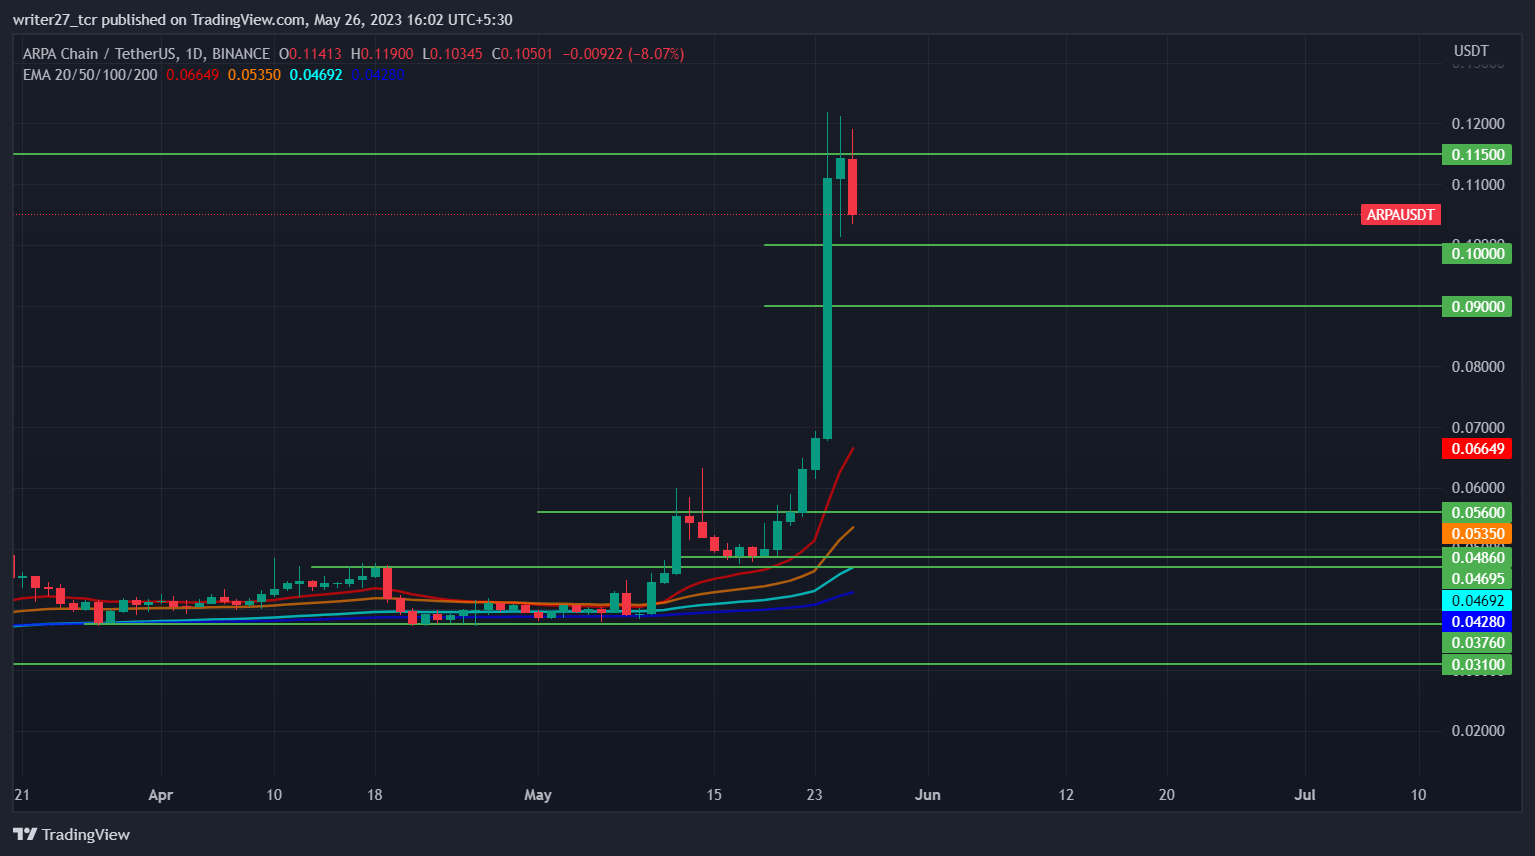
Recently, the ARPA price broke out from the resistance level of $0.056 on May 22. Since the beginning of 2023, ARPA price has been highly bullish, rising from the low of $0.02597 to the current annual high of $0.1218. The move caused a gain of 367% overall.

Source: ARPA/USDT by Trading View.
Price formed support at the $0.04860 level and began to rise, which led to a breaking of the significant resistance level of $0.056. The candle of 22 May did a break and closed above the $0.056 level, which confirmed the bullish momentum had struck the market.
The next candle breached the upper wick of the previous and headed, creating the annual high.
Reason For Bullish Rally in Arpa Price
Arpa Network announced a significant milestone – the release of its TestNet on May 22. The development came after the hard work and dedication of the ARPA team, making an essential step for the project.
The price has gained approximately 118% since the announcement. The current candle has started to retrace either to form a support to rise further higher or correct the impulse move.
Buyers should, for the price to again form support before looking for bids, while the sellers should be aware that the Arpa’s price is in strong bullish momentum.
Will Arpa Price Rise Further?

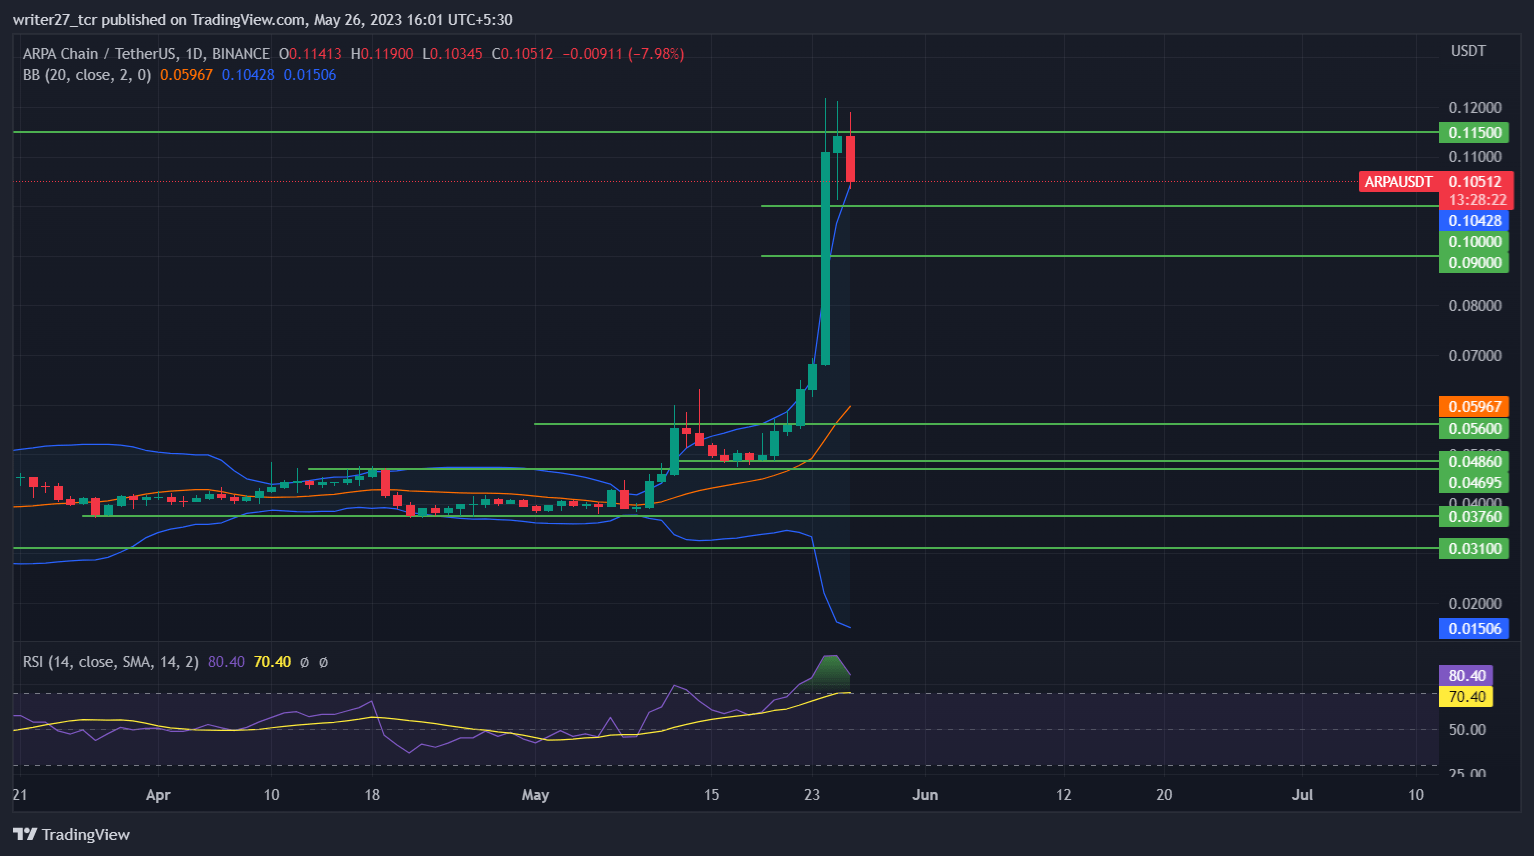
Source: ARPA/USDT by Trading View.
The cryptocurrency price trades above all major EMAs, indicating a bullish momentum in the price. However, the RSI is at 79.88, residing in the overbought zone, indicating a chance of pullback and trend reversal.
Firstly, price needs to form a support, after which there will be a confirmation of the direction in which the price might head. If the bears can break the support, then traders can expect further fall in the price and continuation of correction.
The price is still above the Upper Bollinger Band, suggesting a chance of a pullback. The long/short is 0.99 with 49.95% longs and 50.05% shorts, indicating almost the same pressure from buyers as well as sellers in the last 24 hours.
Conclusion
The market structure and price action for Arpa is highly bullish, and traders should wait for the price to form a support. The technical indicators suggest a pullback, and Arpa’s price might develop support at $0.10 as it can be considered a strong psychological level.
Technical levels
Major support: $0.1 and $0.09
Major resistance: $0.1150 and $0.160
Disclaimer
The views and opinions stated by the author, or any people named in this article, are for informational purposes only. They do not establish financial, investment, or other advice. Investing in or trading crypto assets comes with a risk of financial loss.


 Bitcoin
  Ethereum
  Tether
  USDC
USDC  TRON
TRON  Dogecoin
  Cardano
  Bitcoin Cash
  Chainlink
  Monero
  LEO Token
  Stellar
  Zcash
Zcash  Litecoin
  Hedera
  Dai
Dai  Cronos
  Tether Gold
  OKB
OKB  Ethereum Classic
  KuCoin
  Cosmos Hub
  Gate
Gate  Algorand
  VeChain
  Stacks
  Tezos
Tezos  TrueUSD
  Dash
Dash  IOTA
IOTA  Theta Network
  Basic Attention
  NEO
NEO  Decred
  Synthetix
  Qtum
Qtum  Ravencoin
  0x Protocol
  DigiByte
  Zilliqa
  Nano
Nano  Holo
Holo  Siacoin
  Numeraire
  Waves
Waves  Status
  Ontology
  Enjin Coin
  Hive
Hive  BUSD
BUSD  Pax Dollar
  Lisk
Lisk  Steem
Steem  Huobi
Huobi  OMG Network
  NEM
NEM  Bitcoin Gold
  Augur
Augur  Bitcoin Diamond