


ATOM Technical Analysis: Cosmos Shows Signs of Bullish Reversal

The technical analysis of ATOM exhibits a declining trend with RSI teasing a potential bullish reversal opportunity. So, should you consider buying ATOM? Similar to other crypto markets, ATOM also witnessed a tremendous price rally last week before witnessing a collapse. ATOM touched its 40-day high of $15.71 on November 5, which the token last time hit on September 23, but could not sustain the performance for more than 2 days and lost most of its gain. ATOM has dropped 13.35% in the last 24 hours and 15.08% in the past 7 days. The token is 74.49% below its all-time high of $44.70. With a current price of $11.39, ATOM has a market capitalization of $3.3 billion. While the token’s 24-hour low is $11.28, its daily high stands at $13.97. There are 286.4 million ATOM tokens in circulation.
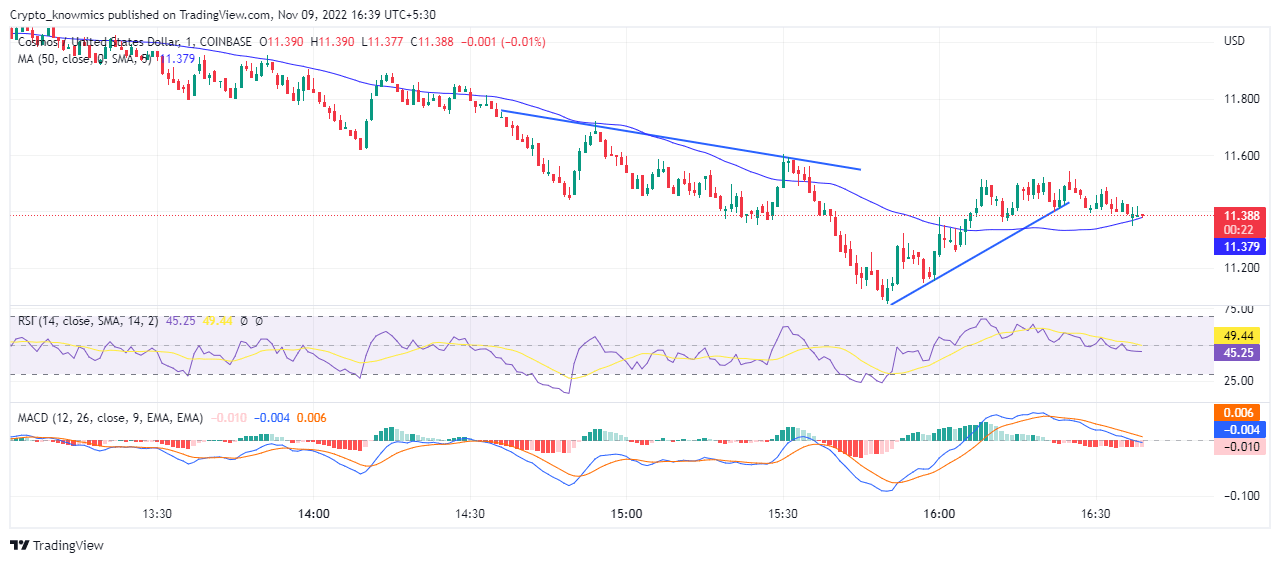
Key Points-
- ATOM price actions show a continuous downtrend breaking the major support level
- The reversal at $11.065 signals the start of a new bull cycle
- The intraday trading volume in Cosmos is $553.76 million
Source: Tradingview
ATOM Technical Analysis
ATOM’s price moving below its 200-day SMA indicates a strong downtrend in the market. However, as the gap between the 200-day SMA and 50-day SMA widens there is little chance of early recovery. With the price action starts making high lows as ATOM takes support above $11.065, the chances of a bullish reversal become quite firm. The daily chart shows that despite the coin coming under selling pressure, it showed signs of recovery when RSI dropped beyond the oversold zone.
Technical Indicators
With RSI slope moving below the 50% level after making multiple divergences around 60% signifies the selling pressure, with the movement of the 14-day SMA above RSI confirming the downtrend. MACD and signal lines give a bearish crossover as both lines move below the halfway line with the histogram already in a negative trend. Technical analysis of ATOM displays an outright bearish trend confirmed by the moving average with a 50-day SMA moving below the support level, as price action show some sign of a bullish reversal.


 Bitcoin
  Ethereum
  Tether
  USDC
USDC  Dogecoin
  Cardano
  Bitcoin Cash
  Polygon
  Litecoin
  LEO Token
  Hedera
  Cosmos Hub
  Stellar
  OKB
OKB  Maker
Maker  Algorand
  NEO
NEO  Gate
Gate  KuCoin
  Synthetix Network
  IOTA
IOTA  Tether Gold
  TrueUSD
  Enjin Coin
  0x Protocol
  Ravencoin
  Siacoin
  Holo
Holo  Basic Attention
  Zcash
Zcash  Decred
  Lisk
Lisk  Ontology
  Waves
Waves  DigiByte
  Numeraire
  Nano
Nano  Pax Dollar
  Status
  Steem
Steem  OMG Network
  BUSD
BUSD  Ren
Ren  Bytom
Bytom  Bitcoin Diamond
  Augur
Augur  HUSD
HUSD  Energi