


Avalanche Price Analysis: Can Avax recuperate from its support mark of $10?

- AVAX shows bearish signals with descending volumes.
- Now, the price is now in a deciding range of rebound or lagging further.
Avax price is now at a previous year’s low, near $11, and looking weak from the last months. Recent intense selling is witnessed in the prices of AVAX, which weakens the bulls’ muscles. In recent weeks, AVAX has tested the lower support range but cannot sustain it. Avalanche price is now trading below its significant moving averages. Moreover, the middle range of the Bollinger band also breaks in the recent sessions leading to a fall in the prices.
Daily chart Suggests To Wait & Watch for Next Swings
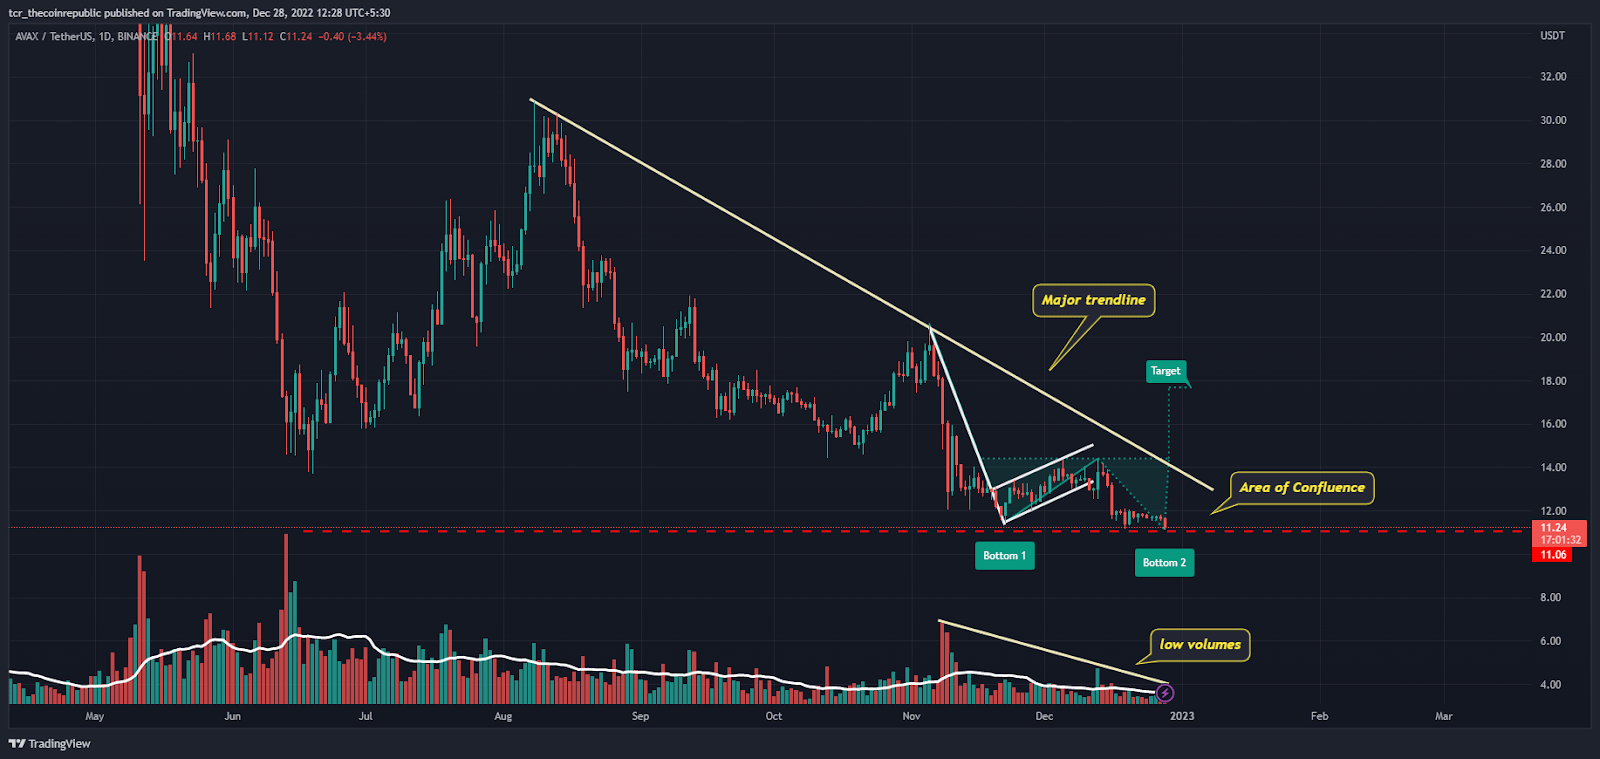
Source: TradingView
On the daily chart, the price is now at a make-or-break level, and buyers have hope now of looking for a trendline breakout. The recent setup conveys a double bottom formation; if AVAX price breaks the neckline at $13, a target of $17 can be seen. Despite the downtrend, $10 is key support where a pullback can be expected.
Moreover, as per Fib levels, now the price is trading at important support; if it slips from here, below support is at $8.40. Furthermore, the RSI justifying the price is near the oversold region where a pullback can be seen.
AVAX is now trading at price $11.31 with an intraday drop of 3%. Moreover, the pair of AVAX/BTC is at 0.0006785 satoshis.
Short Term Chart Shows Price Range Bound Action
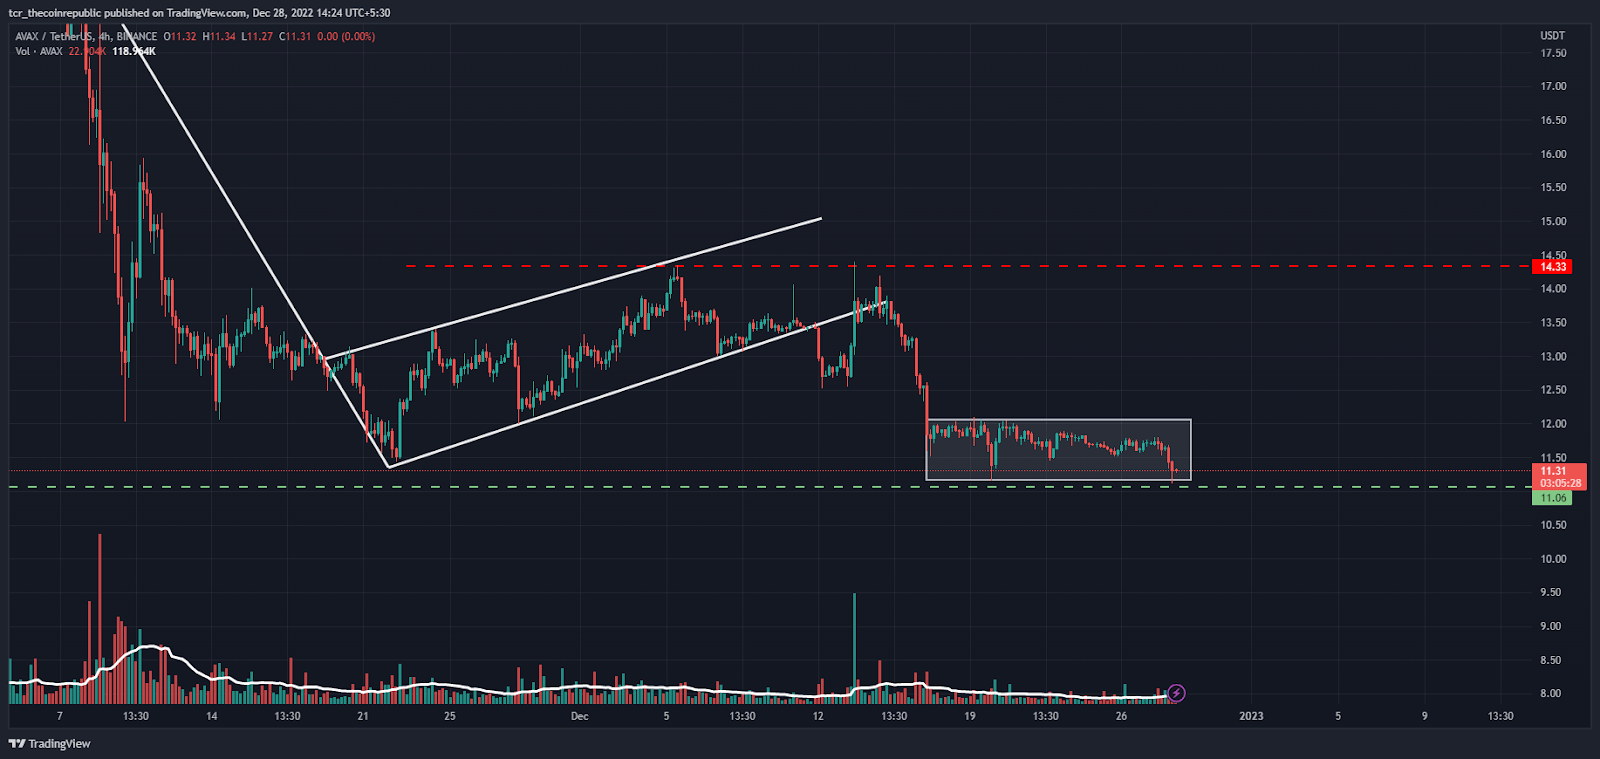
Source: TradingView
On the 4 hours chart, AVAX is trading inside the range between $11- $12, and now in a dilemma showing directionless moves.The trading volume increased by 51% in the last evening showing that investors are looking for a breakout of the trap for making positions.
However, if prices rebound from the range and break the cage now makes a favourable trade for the eagerly waiting investors.
What RSI and MACD says?
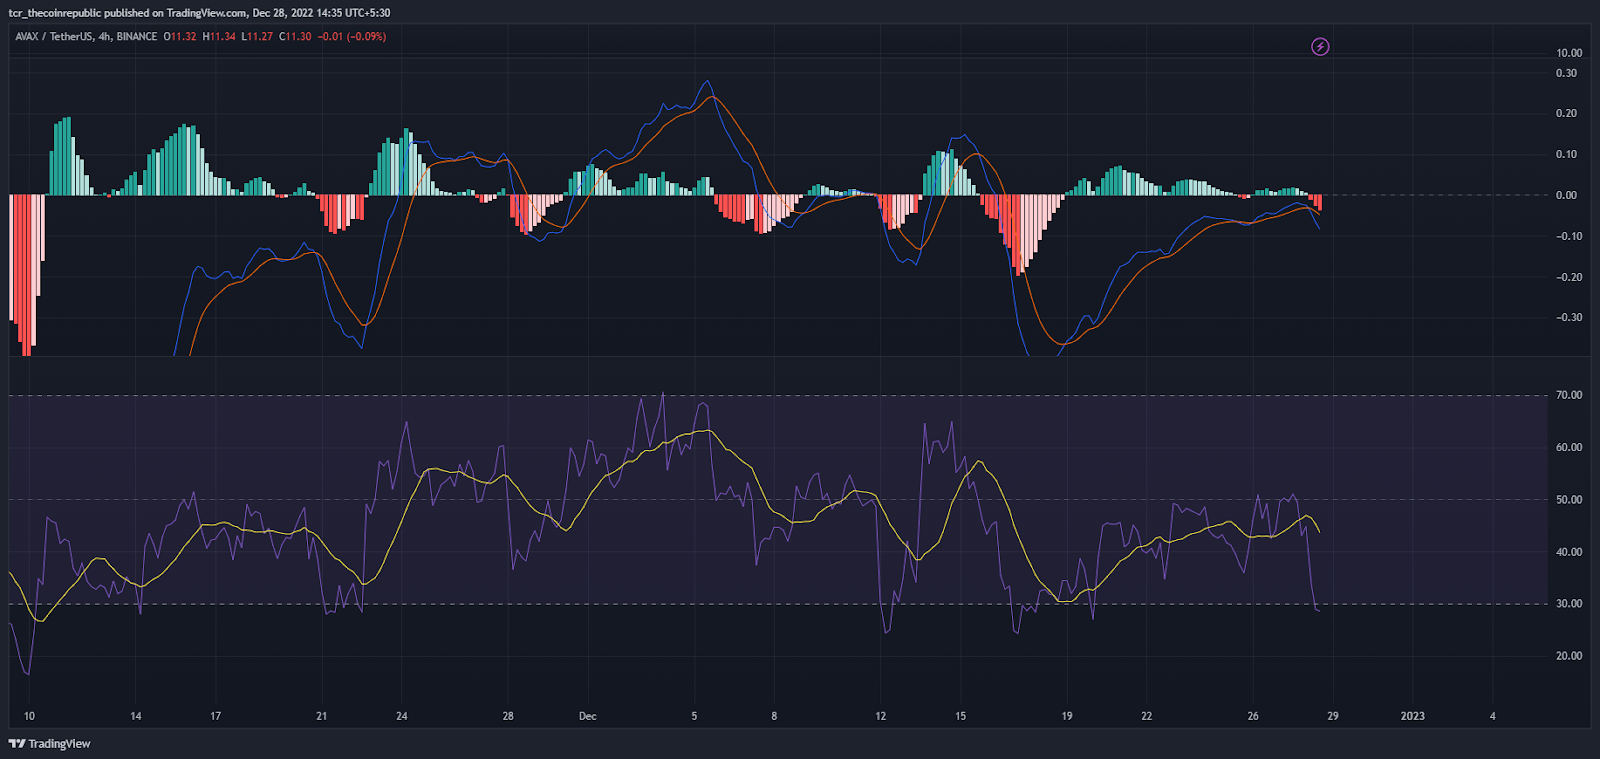
Source: TradingView
RSI: The RSI showing that coin is now heading towards the oversold region and in the near term a pullback is expected. In the meantime, wait & watch for the range breakout to go long or short.
MACD: In the recent sessions, bearish crossover is witnessed and histogram shows the fall. Moreover, the coin is near to its key support indicating a little bounceback from the range.
Conclusion:
Avalanche price indicating weakness from the last couple of days and shrinking its prices with slowly lagging back its leg. However, price now sustains near the support and in the near sessions a pullback can be seen.
Technical Levels:
Support Levels:$10 and $8
Resistance Levels: $14 and $20
Disclaimer
The views and opinions stated by the author, or any people named in this article, are for informational ideas only, and they do not establish financial, investment, or other advice. Investing in or trading crypto assets comes with a risk of financial loss.


 Bitcoin
  Ethereum
  Tether
  USDC
USDC  Dogecoin
  Cardano
  Bitcoin Cash
  Polygon
  Litecoin
  LEO Token
  Hedera
  Cosmos Hub
  Stellar
  OKB
OKB  Maker
Maker  Algorand
  NEO
NEO  Gate
Gate  KuCoin
  Synthetix Network
  IOTA
IOTA  Tether Gold
  TrueUSD
  Enjin Coin
  Holo
Holo  Ravencoin
  0x Protocol
  Siacoin
  Basic Attention
  Zcash
Zcash  Decred
  Ontology
  Lisk
Lisk  Waves
Waves  DigiByte
  Numeraire
  Nano
Nano  Status
  Pax Dollar
  Steem
Steem  OMG Network
  BUSD
BUSD  Ren
Ren  Bitcoin Diamond
  Bytom
Bytom  Energi
  HUSD
HUSD  Augur
Augur