


Bitcoin Cash Analysis: Key Breakout Resistance Sits At $120
- Bitcoin cash is attempting a recovery wave above the $115 resistance against the US Dollar.
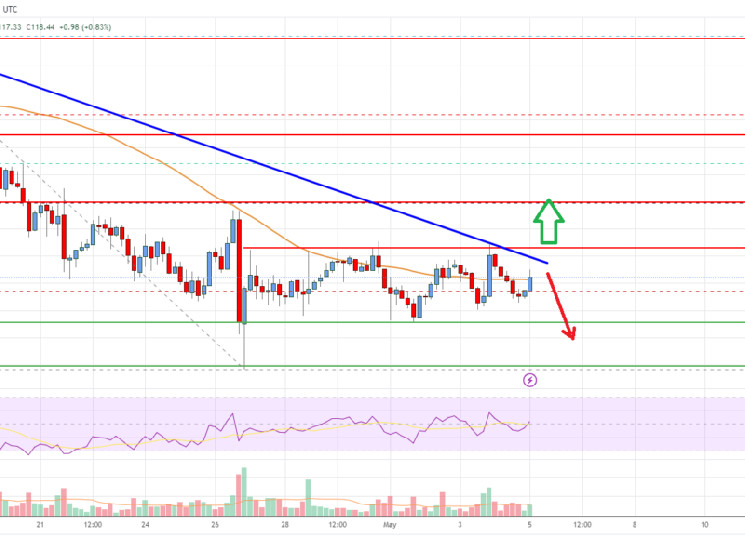
- The price is now trading near the $118 zone and the 55 simple moving average (4 hours).
- There is a key bearish trend line forming with resistance near $120 on the 4-hour chart of the BCH/USD pair (data feed from Coinbase).
- The pair must clear $120 and $124 to start a steady upward movement in the near term.
Bitcoin cash price is consolidating above $115 against the US Dollar, similar to Bitcoin. BCH/USD could start a fresh surge if it clears the $120 level.
Bitcoin Cash Price Analysis
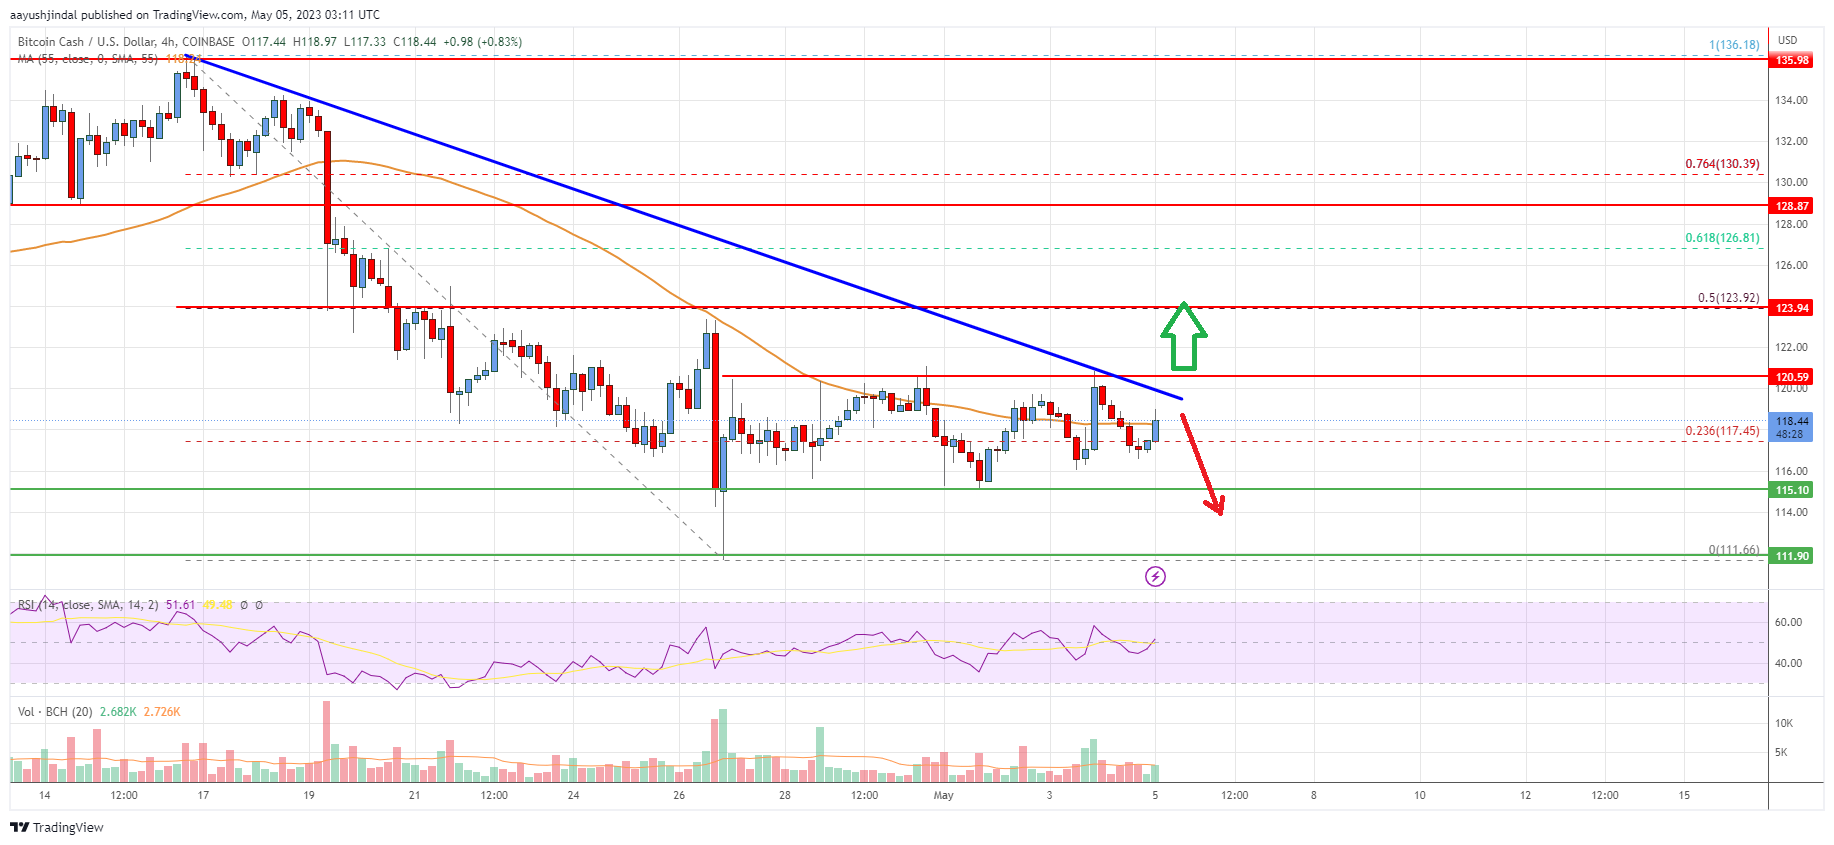
Bitcoin cash price formed a decent support base above the $112 level. BCH started a decent increase and was able to clear the $115 resistance zone.
The price climbed above the $116.50 resistance level. There was a move above the 23.6% Fib retracement level of the downward move from the $136.18 swing high to the $111.66 low. It is now trading near the $118 zone and the 55 simple moving average (4 hours).
On the upside, the price is facing resistance near the $120 level. There is also a key bearish trend line forming with resistance near $120 on the 4-hour chart of the BCH/USD pair.
The next major resistance is near the $124 level or the 50% Fib retracement level of the downward move from the $136.18 swing high to the $111.66 low, above which the price may perhaps rise toward the $130 level. Any more gains above $130 could set the pace for a move toward the $138 level.
If not, the price might decline again. Immediate support on the downside is near the $115 level. The first major support sits near the $112 level. The next major support is near $110, below which the bears might aim for $102. The next target for them may perhaps be near the $100 level.
Bitcoin Cash Price
Looking at the chart, Bitcoin Cash’s price is now trading near the $118 zone and the 55 simple moving average (4 hours). Overall, the price must clear $120 and $124 to continue higher in the near term.
Technical indicators
4 hours MACD – The MACD for BCH/USD is gaining pace in the bullish zone.
4 hours RSI (Relative Strength Index) – The RSI for BCH/USD is above the 50 level.
Key Support Levels – $115 and $112.
Key Resistance Levels – $120 and $124.


 Bitcoin
  Ethereum
  Tether
  USDC
USDC  Dogecoin
  Cardano
  Bitcoin Cash
  Polygon
  Litecoin
  LEO Token
  Hedera
  Stellar
  Cosmos Hub
  OKB
OKB  Maker
Maker  Algorand
  NEO
NEO  Gate
Gate  KuCoin
  Synthetix Network
  IOTA
IOTA  Tether Gold
  TrueUSD
  Enjin Coin
  Ravencoin
  Holo
Holo  0x Protocol
  Siacoin
  Basic Attention
  Zcash
Zcash  Ontology
  Decred
  Waves
Waves  Lisk
Lisk  DigiByte
  Status
  Numeraire
  Nano
Nano  Pax Dollar
  Steem
Steem  OMG Network
  BUSD
BUSD  Ren
Ren  Bytom
Bytom  Bitcoin Diamond
  HUSD
HUSD  Energi
  Augur
Augur