


Bitcoin, Ethereum and XRP Price Prediction: How Long Will Crash Continue?

The Bitcoin (BTC) price is struggling to hold on above the support line of an ascending parallel channel while a significant Fib resistance level rejected the Ethereum price. The XRP price is still trading inside a neutral pattern.
Bitcoin Price Reaches Make-Or-Break Levels
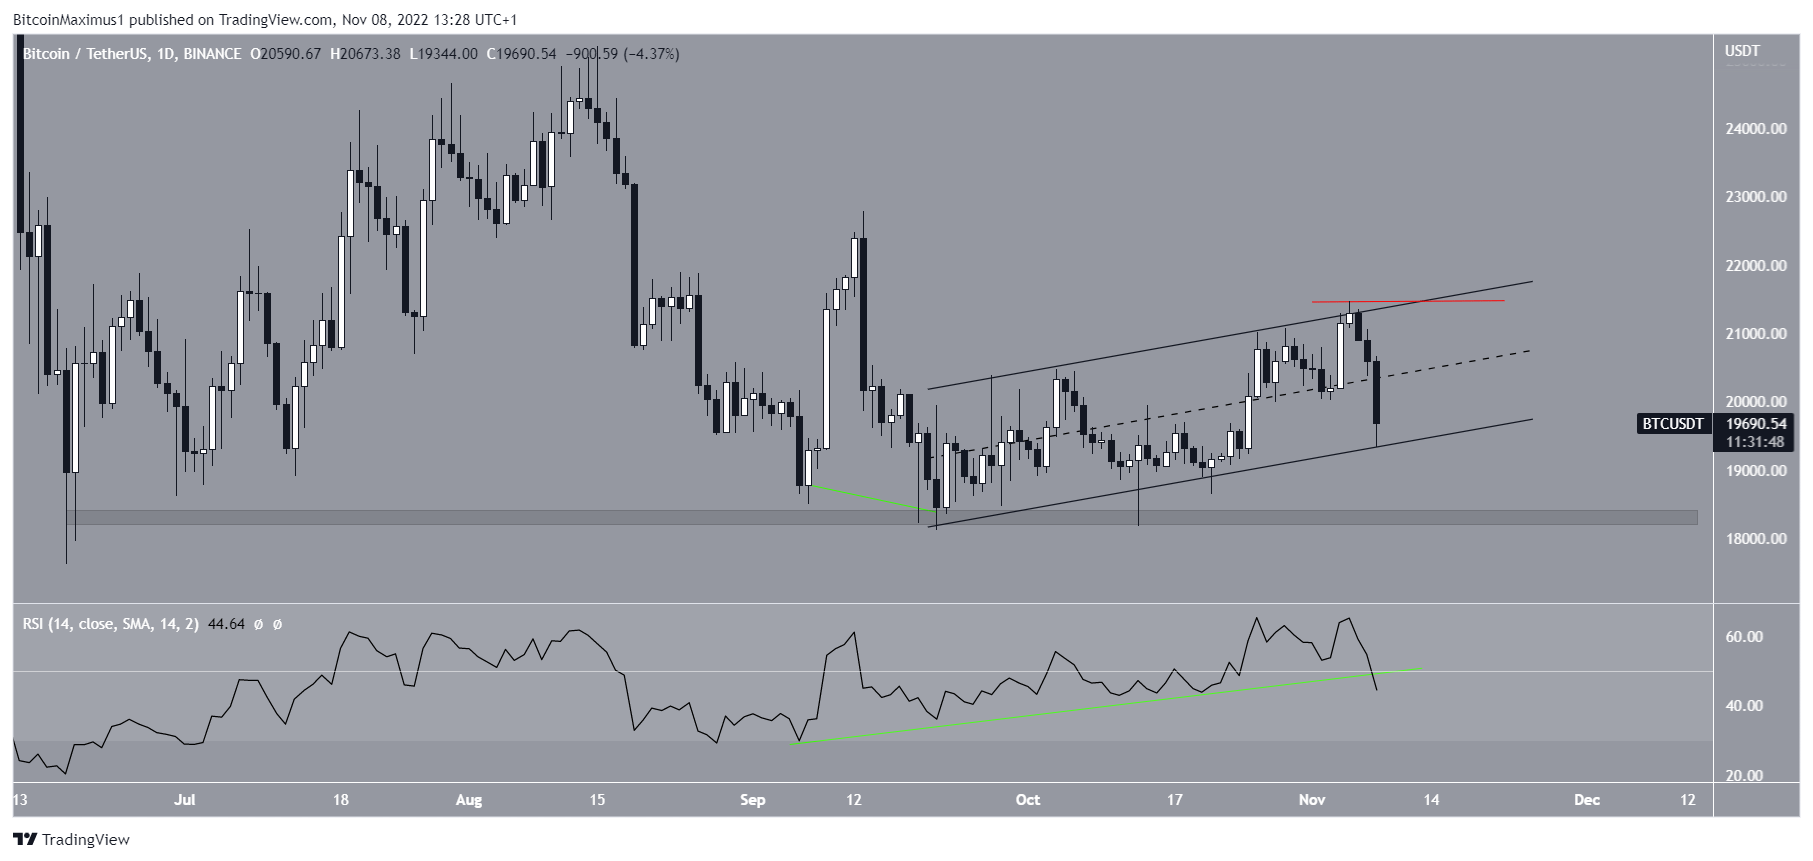
The Bitcoin price has traded inside an ascending parallel channel since Sept. 21. Such channels usually contain corrective movements. As a result, a breakdown from it would be expected.
Additionally, the daily RSI is breaking down from its bullish divergence trend line (green line). A clear RSI breakdown would be expected to precede a price breakdown. It will take the Bitcoin price back to the $18,300 horizontal support area if one occurs.
Conversely, a breakout from the channel at $21,480 (red line) would invalidate the bearish hypothesis.
BTC/USDT Chart By TradingView
Ethereum Price Rejected by Fib Resistance
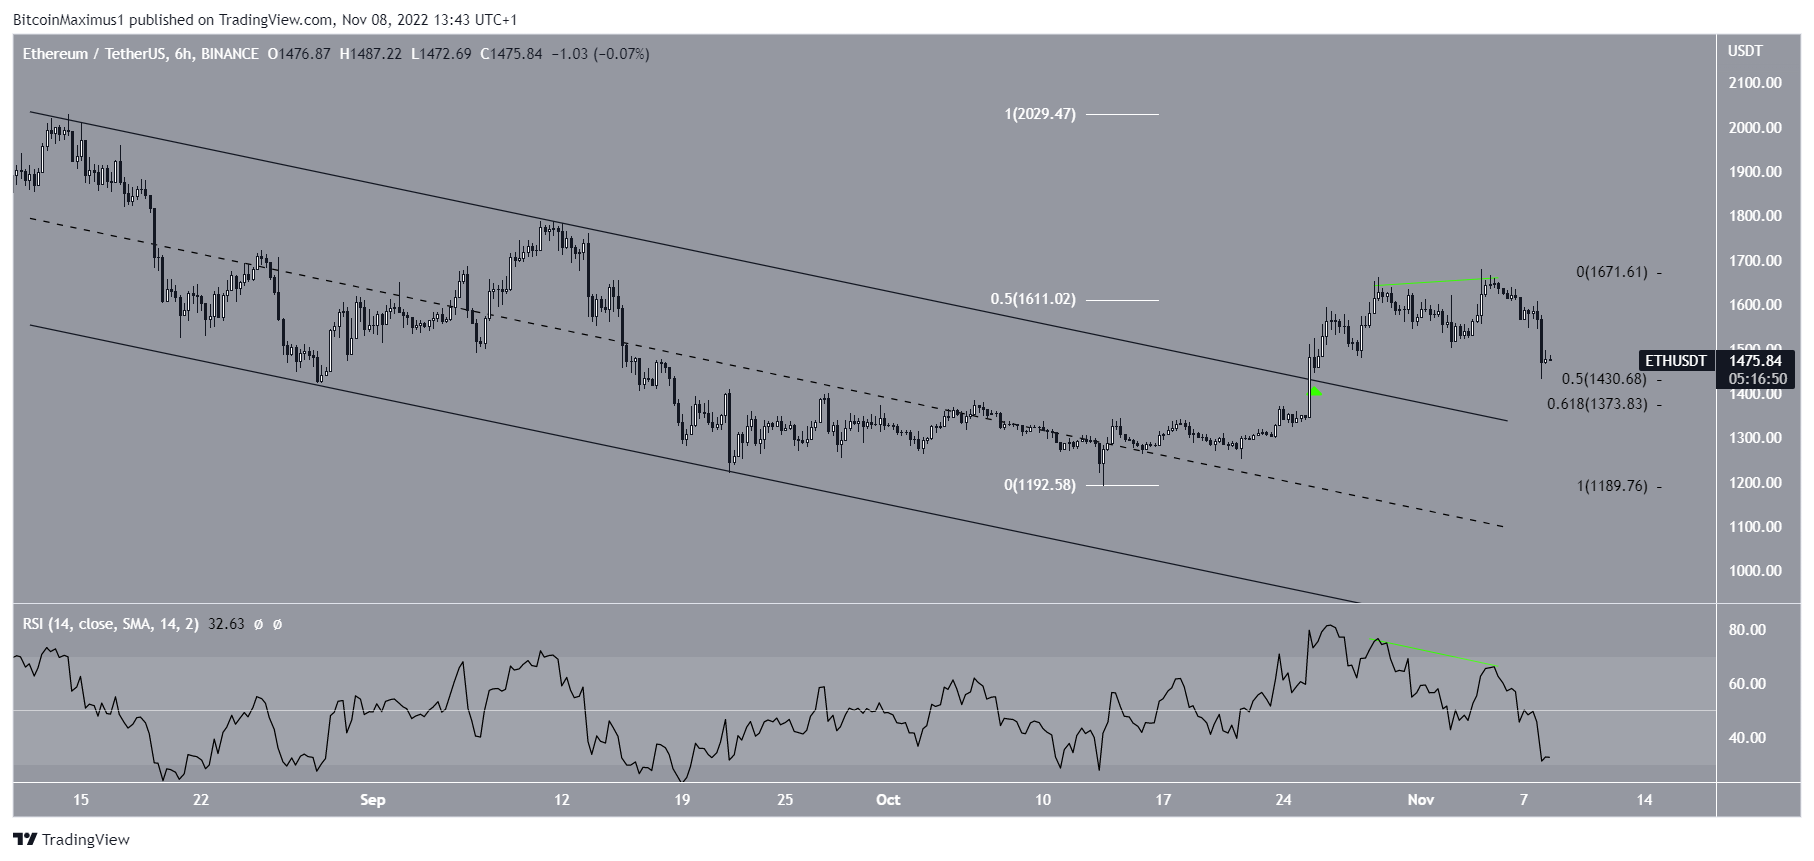
The Ethereum price has been increasing at an accelerated rate since breaking out from a descending parallel channel on Oct. 25. The increased led to a high of $1,680 on Nov. 4. Afterward, the ETH price was rejected by the 0.5 Fib retracement resistance at $1,611. It has decreased over the past 24 hours.
The Ethereum price has fallen since. The downward movement was preceded by bearish divergence in the RSI (green line). Currently, ETH is attempting to find support above the 0.5-0.618 Fib retracement support levels (black) at $1,373-$1,430. Whether it does so or break down could determine the future trend.
ETH/USDT Chart By TradingView
XRP Price Consolidates Inside Neutral Pattern
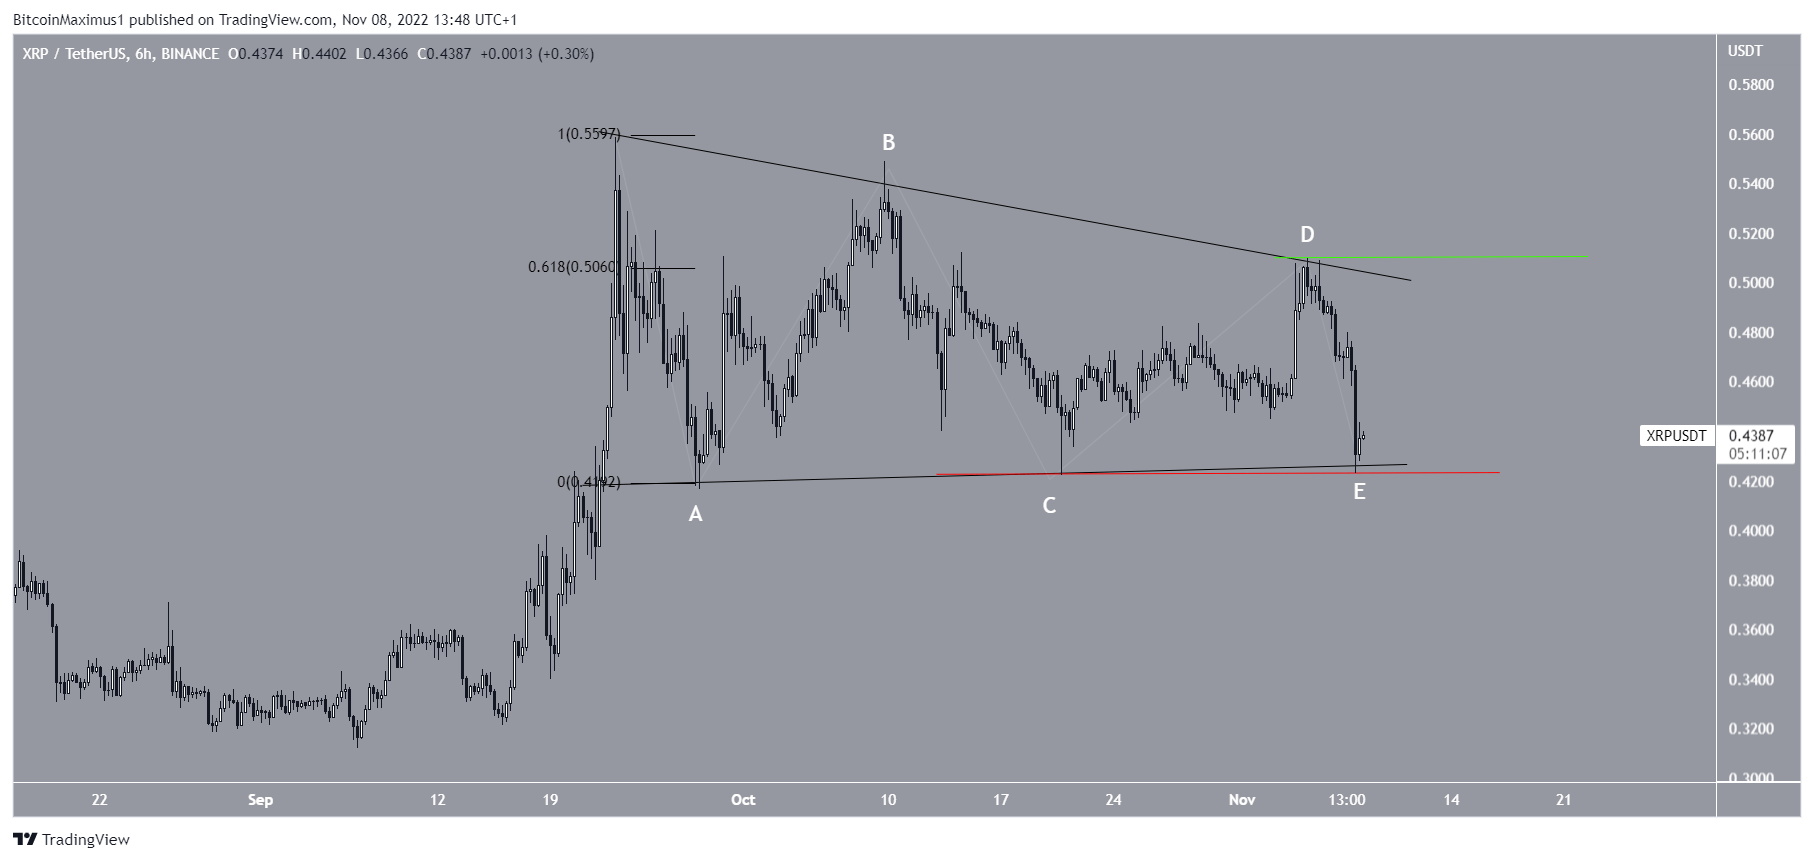
Unlike the Ethereum and Bitcoin price, the same cannot be said for XRP, the global payments’ currency by Ripple Labs. XRP is still trading inside its symmetrical triangle pattern. For the trend to remain valid, the price has to hold on above the current low of $0.42.
If so, a breakout would be expected that would take it above $0.60.
As a result, the trend will be determined by whether the XRP price breaks down below $0.42 (red line) or breaks out above $0.51 (green line).
XRP/USDT Chart By TradingView
Disclaimer: BeInCrypto strives to provide accurate and up-to-date information, but it will not be responsible for any missing facts or inaccurate information. You comply and understand that you should use any of this information at your own risk. Cryptocurrencies are highly volatile financial assets, so research and make your own financial decisions.


 Bitcoin
  Ethereum
  Tether
  USDC
USDC  Dogecoin
  Cardano
  Bitcoin Cash
  Polygon
  Litecoin
  LEO Token
  Hedera
  Cosmos Hub
  Stellar
  OKB
OKB  Maker
Maker  Algorand
  NEO
NEO  Gate
Gate  KuCoin
  Synthetix Network
  IOTA
IOTA  Tether Gold
  TrueUSD
  Enjin Coin
  Holo
Holo  Siacoin
  Ravencoin
  0x Protocol
  Basic Attention
  Zcash
Zcash  Ontology
  Decred
  Lisk
Lisk  Waves
Waves  DigiByte
  Nano
Nano  Pax Dollar
  Status
  Numeraire
  Steem
Steem  OMG Network
  BUSD
BUSD  Ren
Ren  Bytom
Bytom  Bitcoin Diamond
  HUSD
HUSD  Energi
  Augur
Augur