


Bitcoin, Ethereum Price Prediction- Crypto Market Sets Relief Rally?

Bitcoin, Ethereum price prediction: The BTC and ETH price breakout from their respective resistance suggests a possible recovery in the near term. The market leaders’ signs for escaping the consolation phase may push the majority of altcoins higher.
Moreover, by 10:28 am EST, the global crypto market stood at $581 Billion, showing a 2.23% rise since yesterday. However, the total crypto market volume dropped 5.57% and reached the $44.76 Billion mark. The total volume in DeFi is currently at $2.94 Billion, making up 6.65% of the total crypto market 24-hour volume.
Top Gainers and Losers
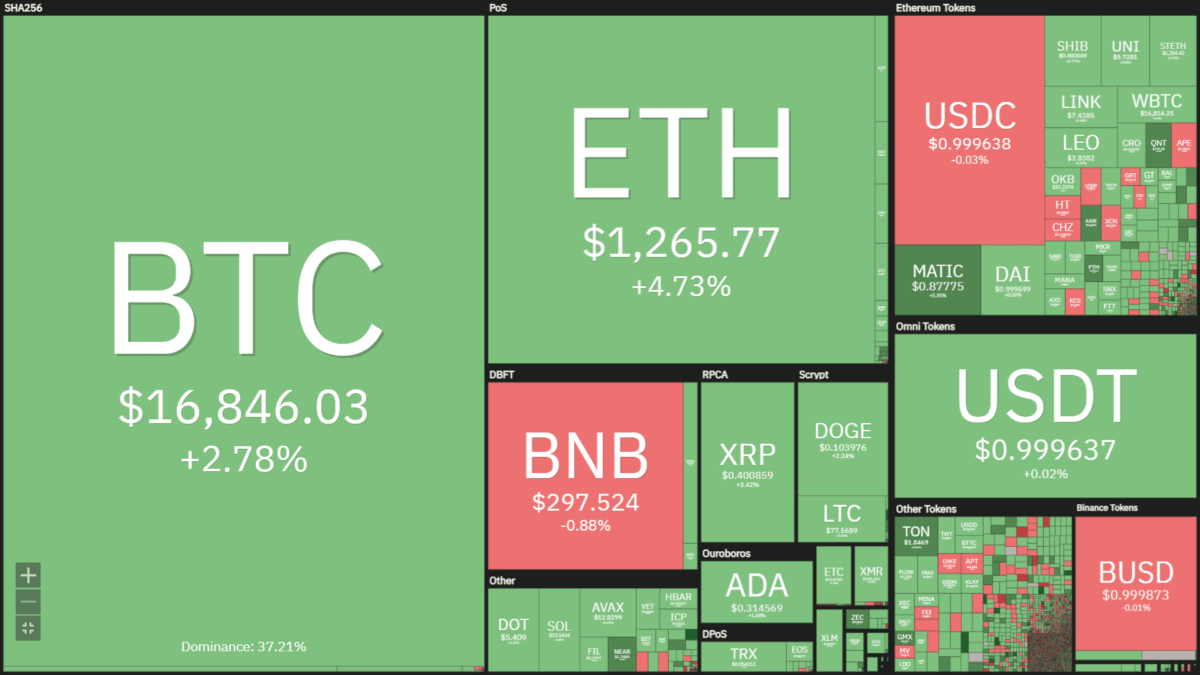
Source- Coin360
With the crypto market in green today, the GMX and Fantom tokens are the highest gains among the top 100 listed cryptocurrencies. In the last 24 hours, the GMX price rose 12.49% to reach the current price of $46.05, whereas the FTM price rose 9.23% to $0.2372. On the flip side, Chain and Helium tokens are experiencing a major loss. The XCN price at $0.041 shows a 4.21% fall, whereas the HNT price at $2.4 reflects a 4% drop.
Bitcoin Price
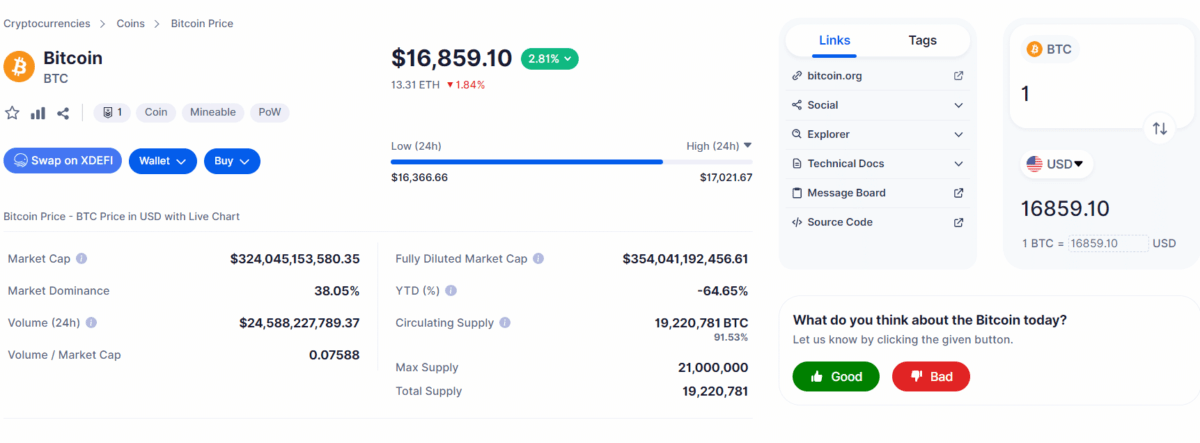
Source- DigitalCoinPrice
A descending trendline had been limiting Bitcoin price growth for over a fortnight. The multiple rejections from this resistance indicated sustained selling from the traders. However, today the coin price jumped 2.5% high and breached the overhead resistance with a significant volume rise.
This bullish breakout indicates a sentiment shift from selling and rallies to buying on dips. Currently, the BTC price trades at $16847 and is expected to retest the breached resistance to check the sustainability for higher prices.
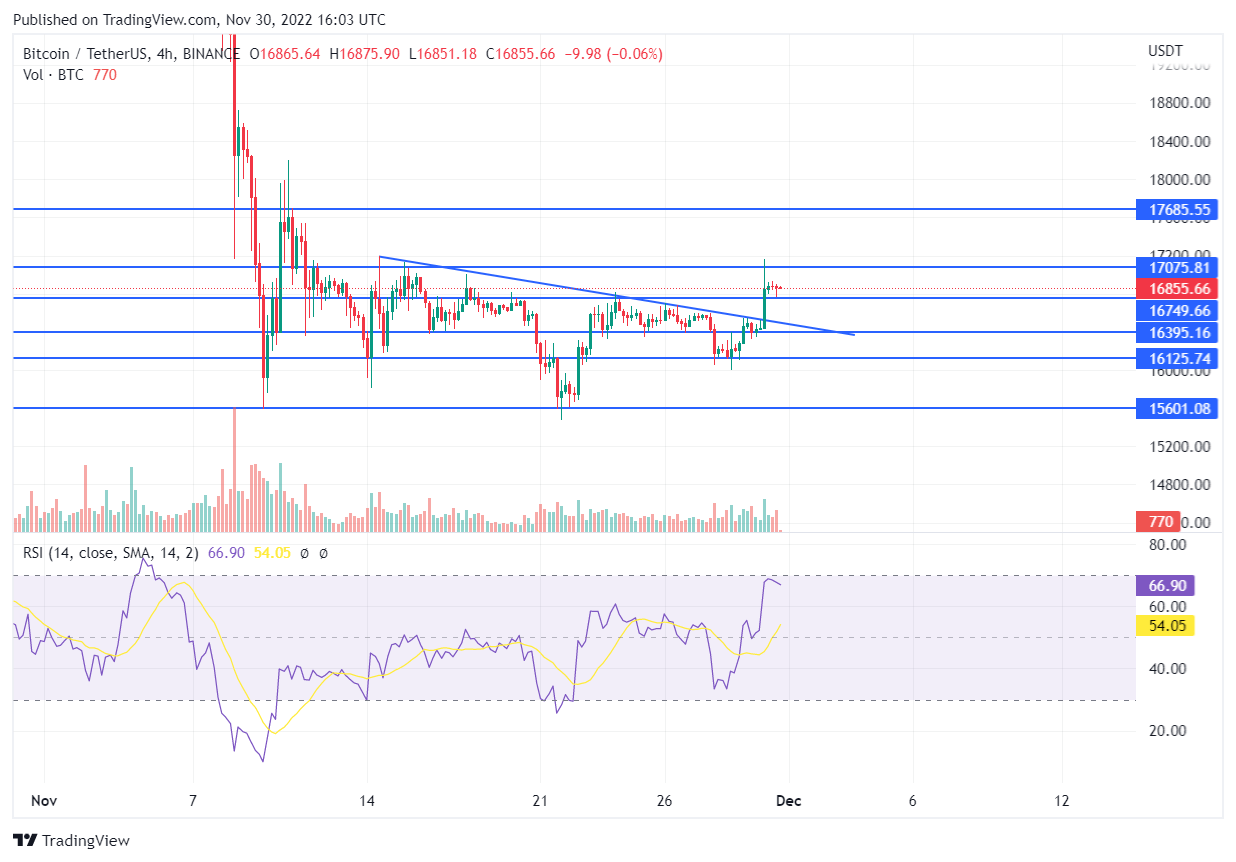
Source- DigitalCoinPrice
If the Bitcoin price sustains above the breached trendline, the price could rise another 8% to hit around the $18000-$18200 supply zone.
However, a 4-hour candle closing below the trendline could offset the bullish thesis.
Ethereum price

Source- DigitalCoinPrice
The ongoing consolidation in Ethereum 4-hour time frame chart revealed the formation of an inverted head and should pattern. This bullish reversal chart pattern offers a significant upswing upon the breakout of its neckline resistance.
The $1231 mark stands as a neckline resistance for this pattern, and today, with a 4% jump and a high spike in volume, the prices breached this barrier. This breakout offers a long-entry opportunity for interested traders if the coin sustains the upcoming retest phase.
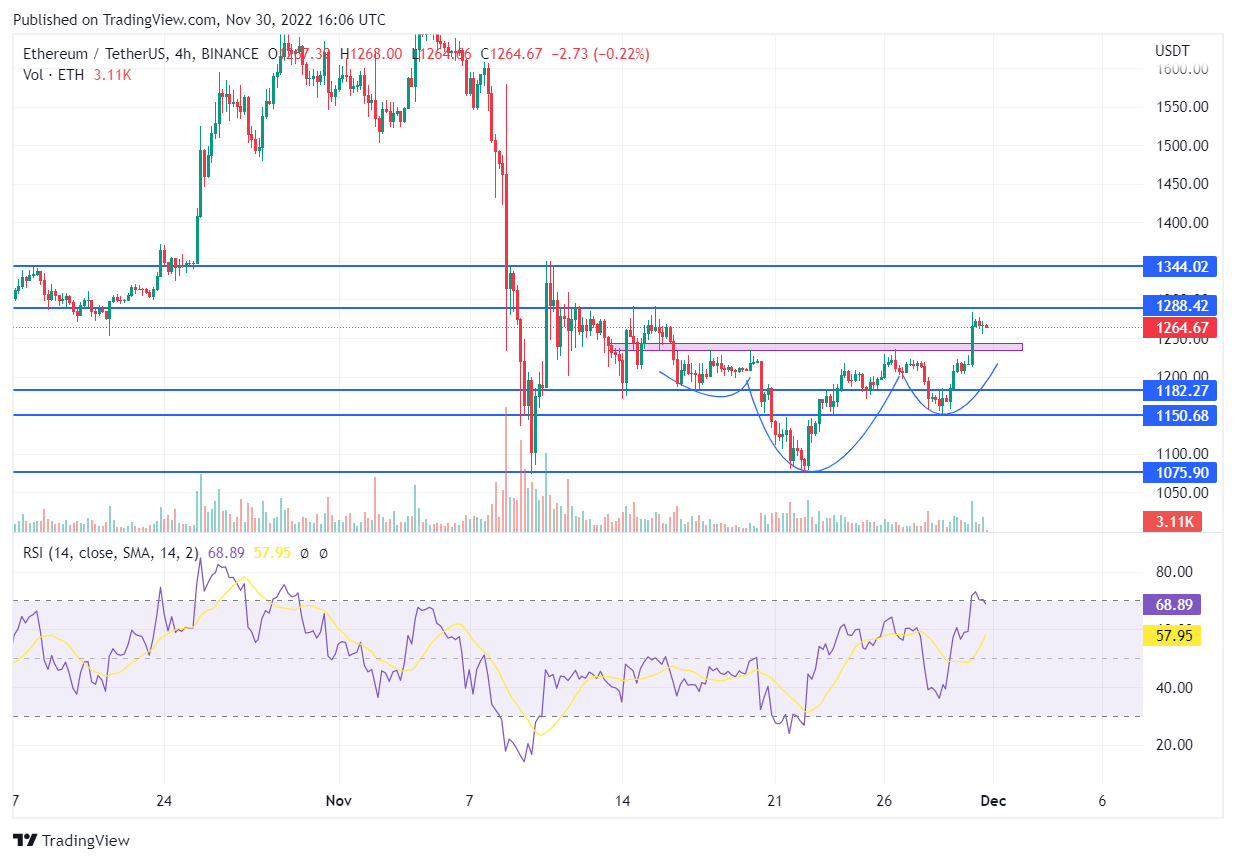
Source-DigitalCoinPrice
As per the technical setup, this distance between the lowest swing and neckline of the pattern shot from the breakout point is out of target. Thus, the post-retest rally may drive the ETH price up 9% to reach $1385.


 Bitcoin
  Ethereum
  Tether
  USDC
USDC  Dogecoin
  Cardano
  Bitcoin Cash
  Polygon
  Litecoin
  LEO Token
  Hedera
  Cosmos Hub
  Stellar
  OKB
OKB  Maker
Maker  Algorand
  NEO
NEO  Gate
Gate  KuCoin
  Synthetix Network
  IOTA
IOTA  Tether Gold
  TrueUSD
  Enjin Coin
  Holo
Holo  Ravencoin
  0x Protocol
  Siacoin
  Basic Attention
  Zcash
Zcash  Decred
  Ontology
  Lisk
Lisk  Waves
Waves  DigiByte
  Numeraire
  Nano
Nano  Status
  Pax Dollar
  Steem
Steem  OMG Network
  BUSD
BUSD  Ren
Ren  Bitcoin Diamond
  Bytom
Bytom  Energi
  HUSD
HUSD  Augur
Augur