


BSV Price Analysis: Token forms a strong bearish candle, can bulls hold the $34.80 level?
- The BSV token price is trading below the demand zone on a daily time frame.
- The pair of BSV/USDT is trading at the price level of $40.53 with a gain of 3.20% in the past 24 hours.
On a daily time frame, the BSV token is trading below the demand zone. The token had a surge, but it was only a retracement till the demand zone, and after that bears continued to push the token’s price down.
BSV on the daily chart
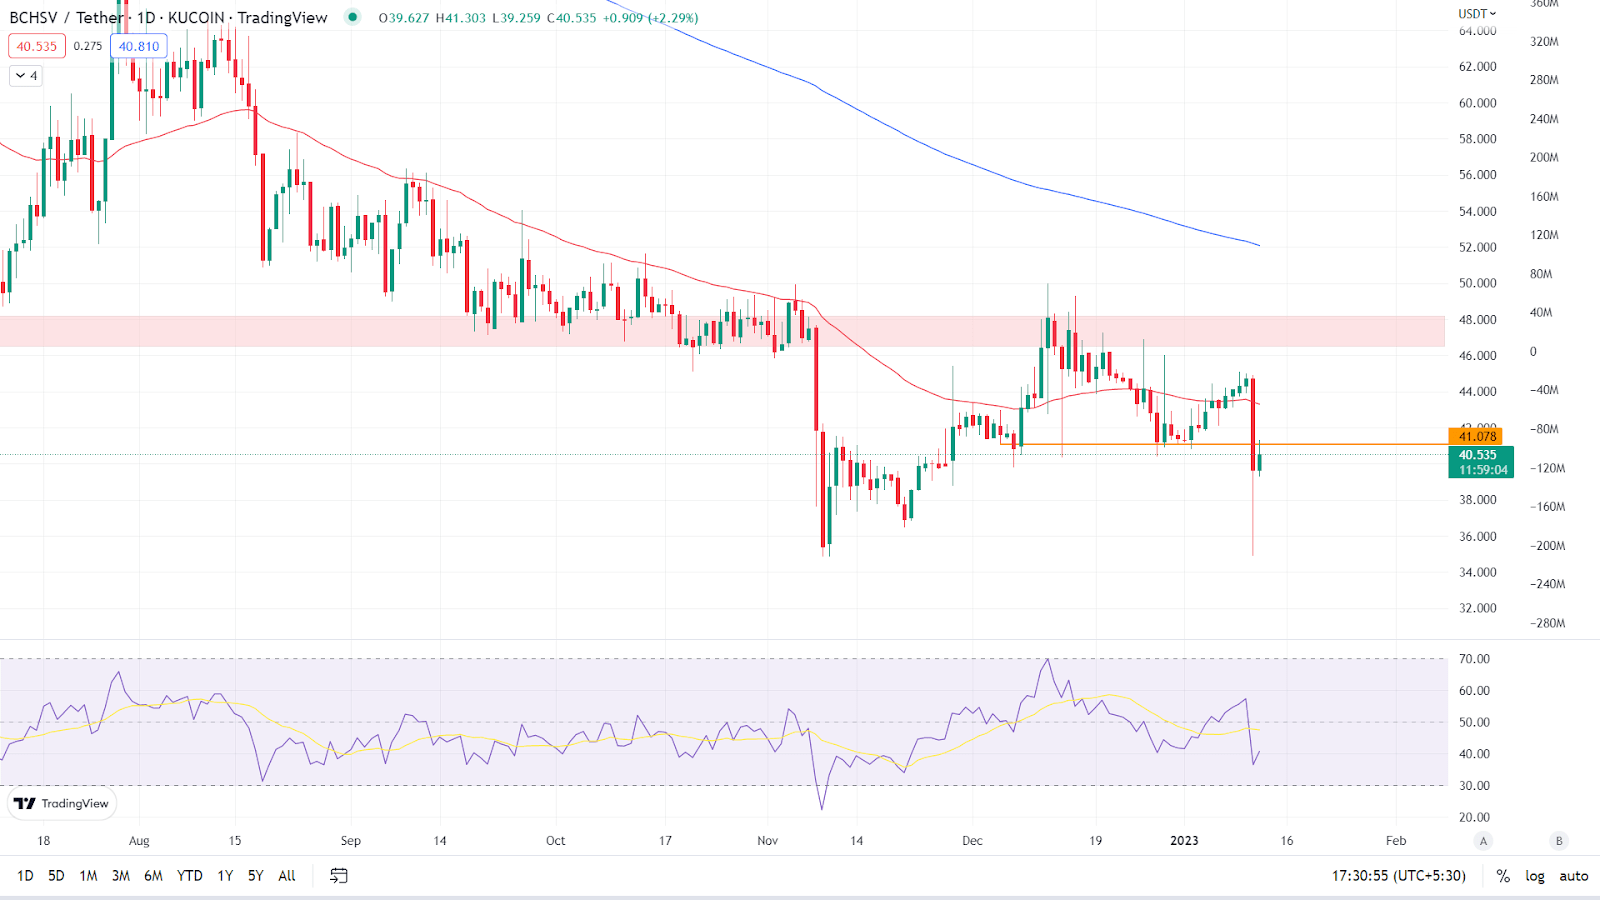
Source: TradingView
The token’s overall outlook is bearish, with prices forming lower highs and lower lows. According to the daily chart, BSV is currently trading at $40.53, up 3.20% in the last 24 hours. It is currently trading below its key Moving Averages which are 50 and 200 EMA. (Red line is 50 EMA and the blue line is 200 EMA). The token is constantly facing resistance at the 50 EMA and is unable to sustain above it.
Relative Strength Index: The asset’s RSI curve is currently trading at 42.16, indicating that it is in the oversold zone. The RSI curve has crossed below the 14 SMA, indicating bearishness. A strong bearish candle was formed, leading the RSI curve value to fall sharply. If the price of the token continues to decline, the value of RSI will continue to fall even lower.
Analyst view & Expectations
After a significant decrease in the token’s price, the token showed bullish momentum, however it was only a retracement and was unable to hold the higher levels. Investors are advised not to buy right now and to wait for more clarity on the trend’s direction. Intraday traders, on the other hand, have a good opportunity to go short if the token closes below $34.80 and can aim for lower levels.
According to our current Bitcoin SV (BSV) price prediction, the price of Bitcoin SV (BSV) will fall by -1.46% and hit $ 40.37 in the next few days. Our technical indicators indicate that the current sentiment is bearish, with the Fear & Greed Index reading 30. (Fear). Over the previous 30 days, Bitcoin SV has 14/30 (47%) green days and 4.05% price volatility. According to our Bitcoin SV forecast, now is not the moment to buy Bitcoin SV.
Technical Levels
Major support: $34.80
Major resistance: $48.16 & 50 EMA.
Conclusion
On a daily time frame, the BSV token price has slipped below the demand zone. The BSV token price is forming a bearish chart pattern based on the price action. It remains to be seen if the token price can rebound from the long-term demand zone or break through and fall. Investors should wait for a clear indication before investing.
Disclaimer: The views and opinions stated by the author, or any people named in this article, are for informational ideas only, and they do not establish the financial, investment, or other advice. Investing in or trading crypto assets comes with a risk of financial loss.


 Bitcoin
  Ethereum
  Tether
  USDC
USDC  Dogecoin
  Cardano
  Bitcoin Cash
  Polygon
  Litecoin
  LEO Token
  Hedera
  Cosmos Hub
  Stellar
  OKB
OKB  Maker
Maker  Algorand
  NEO
NEO  Gate
Gate  KuCoin
  Synthetix Network
  IOTA
IOTA  Tether Gold
  TrueUSD
  Enjin Coin
  Holo
Holo  Ravencoin
  0x Protocol
  Siacoin
  Basic Attention
  Zcash
Zcash  Decred
  Ontology
  Lisk
Lisk  Waves
Waves  DigiByte
  Numeraire
  Nano
Nano  Status
  Pax Dollar
  Steem
Steem  OMG Network
  BUSD
BUSD  Ren
Ren  Bitcoin Diamond
  Bytom
Bytom  HUSD
HUSD  Energi
  Augur
Augur