


BTT Price Analysis: Is BTT price action showing a mirage?

- BTT price might be currently consolidating in the supply zone
- BTT price technical indicators are favouring an upside move for a new high in the future.
BTT is a popular peer-to-peer file-sharing and torrent platform. Recently the investors have been showing quite a bit of enthusiasm regarding Bit Torrent but as of now it seems like they are facing indecision however BTT will need the support of the buyers at the current level to continue its enthusiastic bull trend. The current price of BTT is $0.000000727 with a change in 24-hour trading volume of -31.18%. Bit Torrent is down 2.47% in the last 24 hours.
BTT going through indecision

Source: BTT/USDT by TradingView
Bit Torrent recently made a tremendous bullish rally of 20 percent after making a bullish pattern of the double bottom near the price of $0.000000726 but after taking a retest BTT is presently consolidating within a range constantly taking support from the 50 EMA. BTT’s price did try breaking down the consolidation but again after making a double-bottom pattern it started consolidating with the previous ranges.
A picture is worth a thousand words hence further analysis on a smaller timeframe.
A look into the smaller timeframe (On 4hr timeframe)
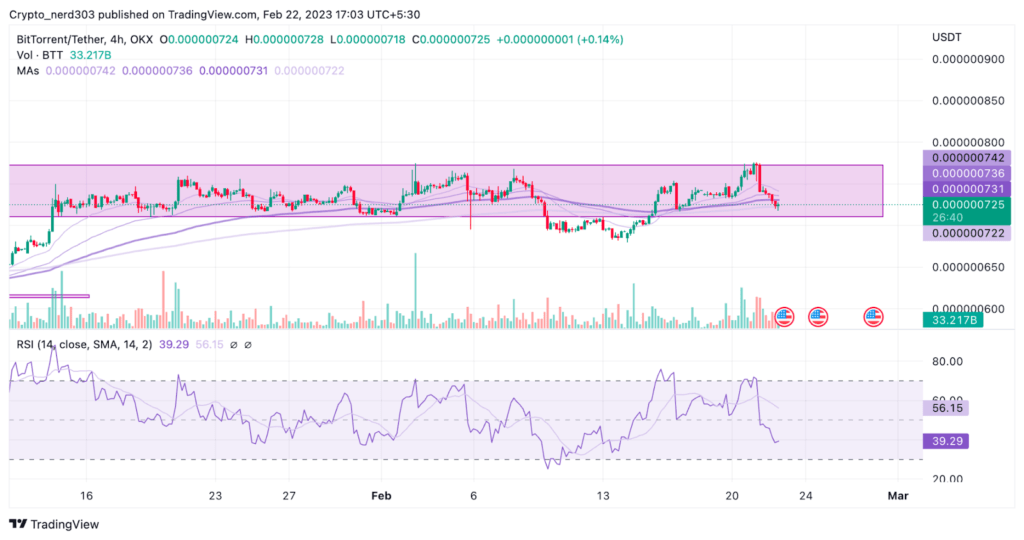
Source: BTT/USDT by TradingView
Bit Torrent is currently following a nice uptrend on the 4hr timeframe where the price is trending above the 200 EMA while giving a crossover between the 20 EMA and 50 EMA. Also on the daily timeframe, the price has crossed over the 50 EMA with a strong moment while taking consistent support from it.
BTT price is making a near-perfect consolidation channel between the price range of $0.000000773 and $0.000000711. This consolidation means that the current market is moving sideways not really going either way giving a big. This is a sign that the buyer is accumulating the token and holding it.
The RSI is currently showing some indication of divergence while the price is making a sideways consolidation RSI is predicting a downtrend although RSI is currently trading near the median level of 49 points while taking support from the 14 SMA suggesting that the RSI might take a reversal from the median line also on a smaller timeframe RSI is trading near the over-sold level near 39 points.
Conclusion
In conclusion of the above article, it can be estimated that BTT might soon break its consolidation the readers are suggested to wait for a clear indication in the form of price breaking the consolidation channel or the RSI taking a clear direction for the upcoming direction although this consolidation pattern is providing an appropriate opportunity for the short term traders.
Technical levels –
Support – $0.000000711
Resistance – $0.000000773
Disclaimer
The views and opinions stated by the author, or any people named in this article, are for informational purposes only, and they do not establish financial, investment, or other advice. Investing in or trading crypto assets comes with a risk of financial loss.


 Bitcoin
  Ethereum
  Tether
  USDC
USDC  Dogecoin
  Cardano
  Bitcoin Cash
  Polygon
  Litecoin
  LEO Token
  Hedera
  Cosmos Hub
  Stellar
  OKB
OKB  Maker
Maker  Algorand
  Gate
Gate  NEO
NEO  KuCoin
  Synthetix Network
  IOTA
IOTA  Tether Gold
  TrueUSD
  Enjin Coin
  Siacoin
  Holo
Holo  0x Protocol
  Ravencoin
  Basic Attention
  Zcash
Zcash  Decred
  Lisk
Lisk  Ontology
  Waves
Waves  DigiByte
  Numeraire
  Pax Dollar
  Nano
Nano  Status
  Steem
Steem  OMG Network
  BUSD
BUSD  Ren
Ren  Bytom
Bytom  Bitcoin Diamond
  Augur
Augur  Energi
  HUSD
HUSD