


Calm Before the Storm: Will XRP Finally Explode Above $0.4? (Ripple Price Analysis)
Ripple’s price has been consolidating in a tight range against the USD. However, against BTC, it has yet to manifest a significant move.
Technical Analysis
By: Edris
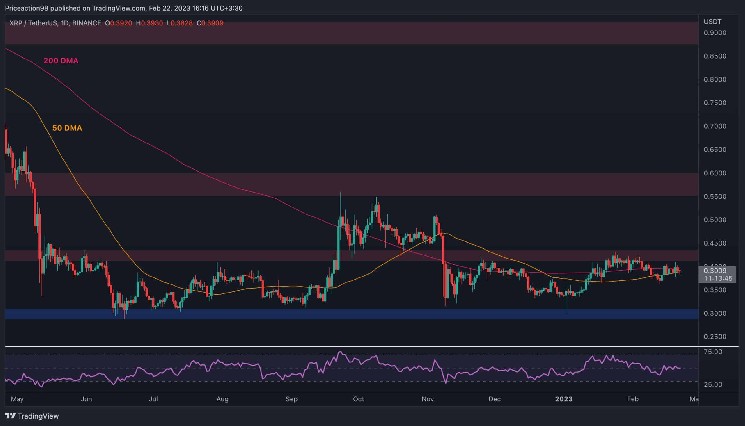
XRP/USDT Daily Chart
The price failed to break above the $0.43 resistance level and has been trapped in a tight range between the 50-day and 200-day moving average lines, located around the $0.38 and $0.4 levels, respectively.
A breakout to the upside would likely lead to another test of the $0.43 level, with the probability for a bullish breakout being seemingly higher this time, as the level should be weakened by so many retests over the last few months.
In this case, a rally toward the $0.6 area would be probable. On the other hand, a breakdown of the 50-day moving average would result in a potential drop toward the key $0.3 support level in the coming weeks.

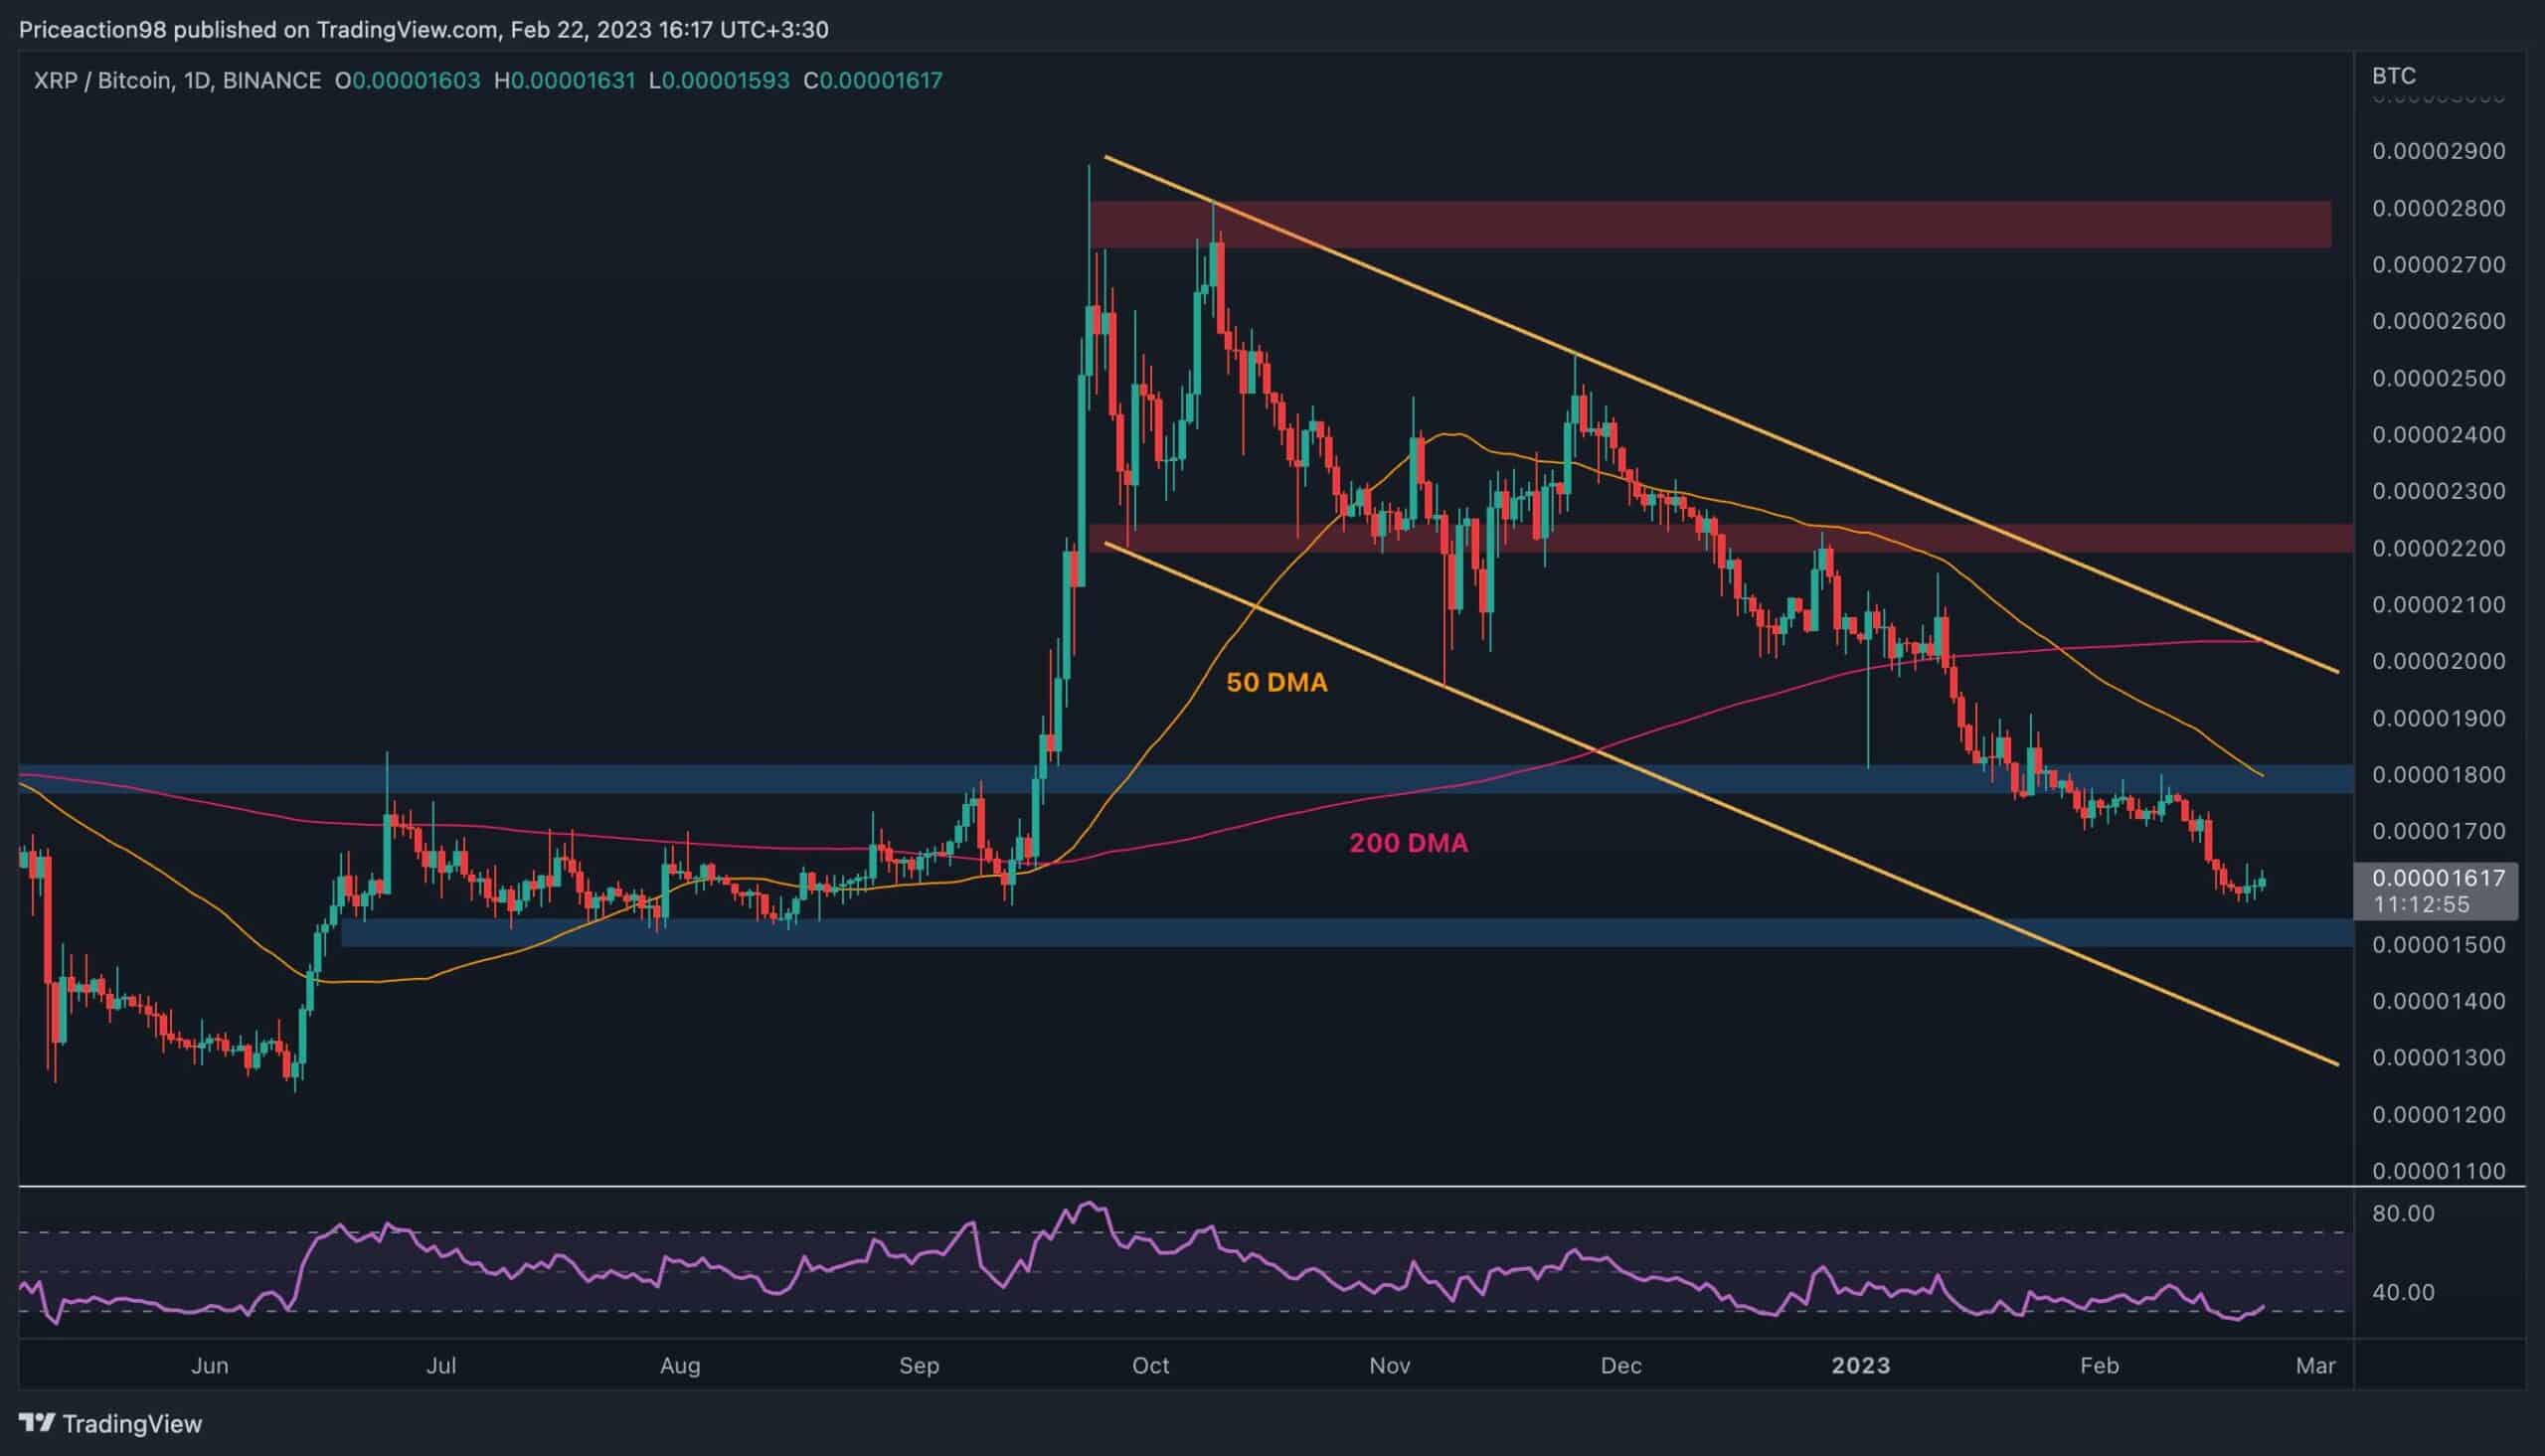
XRP/BTC Daily Chart
Looking at the Bitcoin chart, the market structure is clearly bearish on the daily timeframe, with the significant 0.000018 level getting broken to the downside several weeks ago.
The price has been trending down since then, but the RSI indicator is pointing to a potential bullish pullback in the short term, with the indicator dropping below and recovering above the oversold zone.
In case of a bullish move, the broken 0.000018 level and the 50-day moving average located around the same area would be the likely targets. Yet, the price could still drop deeper and test the key 0.000015 level, which would be the bulls’ last resort to prevent a further crash to the downside.


 Bitcoin
  Ethereum
  Tether
  USDC
USDC  Dogecoin
  Cardano
  Bitcoin Cash
  Polygon
  Litecoin
  LEO Token
  Hedera
  Stellar
  Cosmos Hub
  OKB
OKB  Maker
Maker  Algorand
  NEO
NEO  Gate
Gate  KuCoin
  Synthetix Network
  IOTA
IOTA  Tether Gold
  TrueUSD
  Holo
Holo  Enjin Coin
  0x Protocol
  Ravencoin
  Siacoin
  Basic Attention
  Ontology
  Zcash
Zcash  Decred
  Waves
Waves  Lisk
Lisk  DigiByte
  Nano
Nano  Status
  Numeraire
  Pax Dollar
  Steem
Steem  OMG Network
  BUSD
BUSD  Ren
Ren  Bytom
Bytom  Bitcoin Diamond
  HUSD
HUSD  Energi
  Augur
Augur