


Can Bitcoin (BTC) Price Bounce Back Over $30,000? This Indicator Suggests it Could

The Bitcoin (BTC) price has fallen since a long-term horizontal resistance area rejected it. It now trades in a short-term bearish pattern.
A breakdown from the neckline of this pattern could catalyze a sharp fall. Additionally, it will confirm the validity of the long-term rejection.
BTC Price Deviates and Gets Rejected
The BTC price decreased significantly after forming a bearish engulfing candlestick pattern during the week of April 17-24. This type of pattern occurs when the entire gains from the previous period are wiped out in the next one. It indicates a bearish sentiment.
While the price tried to increase next week, it was stopped by the $29,800 resistance zone (red icon). Therefore, the movement over the past three weeks resembles a failed breakout and validation of that area as resistance (red icon).
These are all bearish signs that usually lead to downward movements.
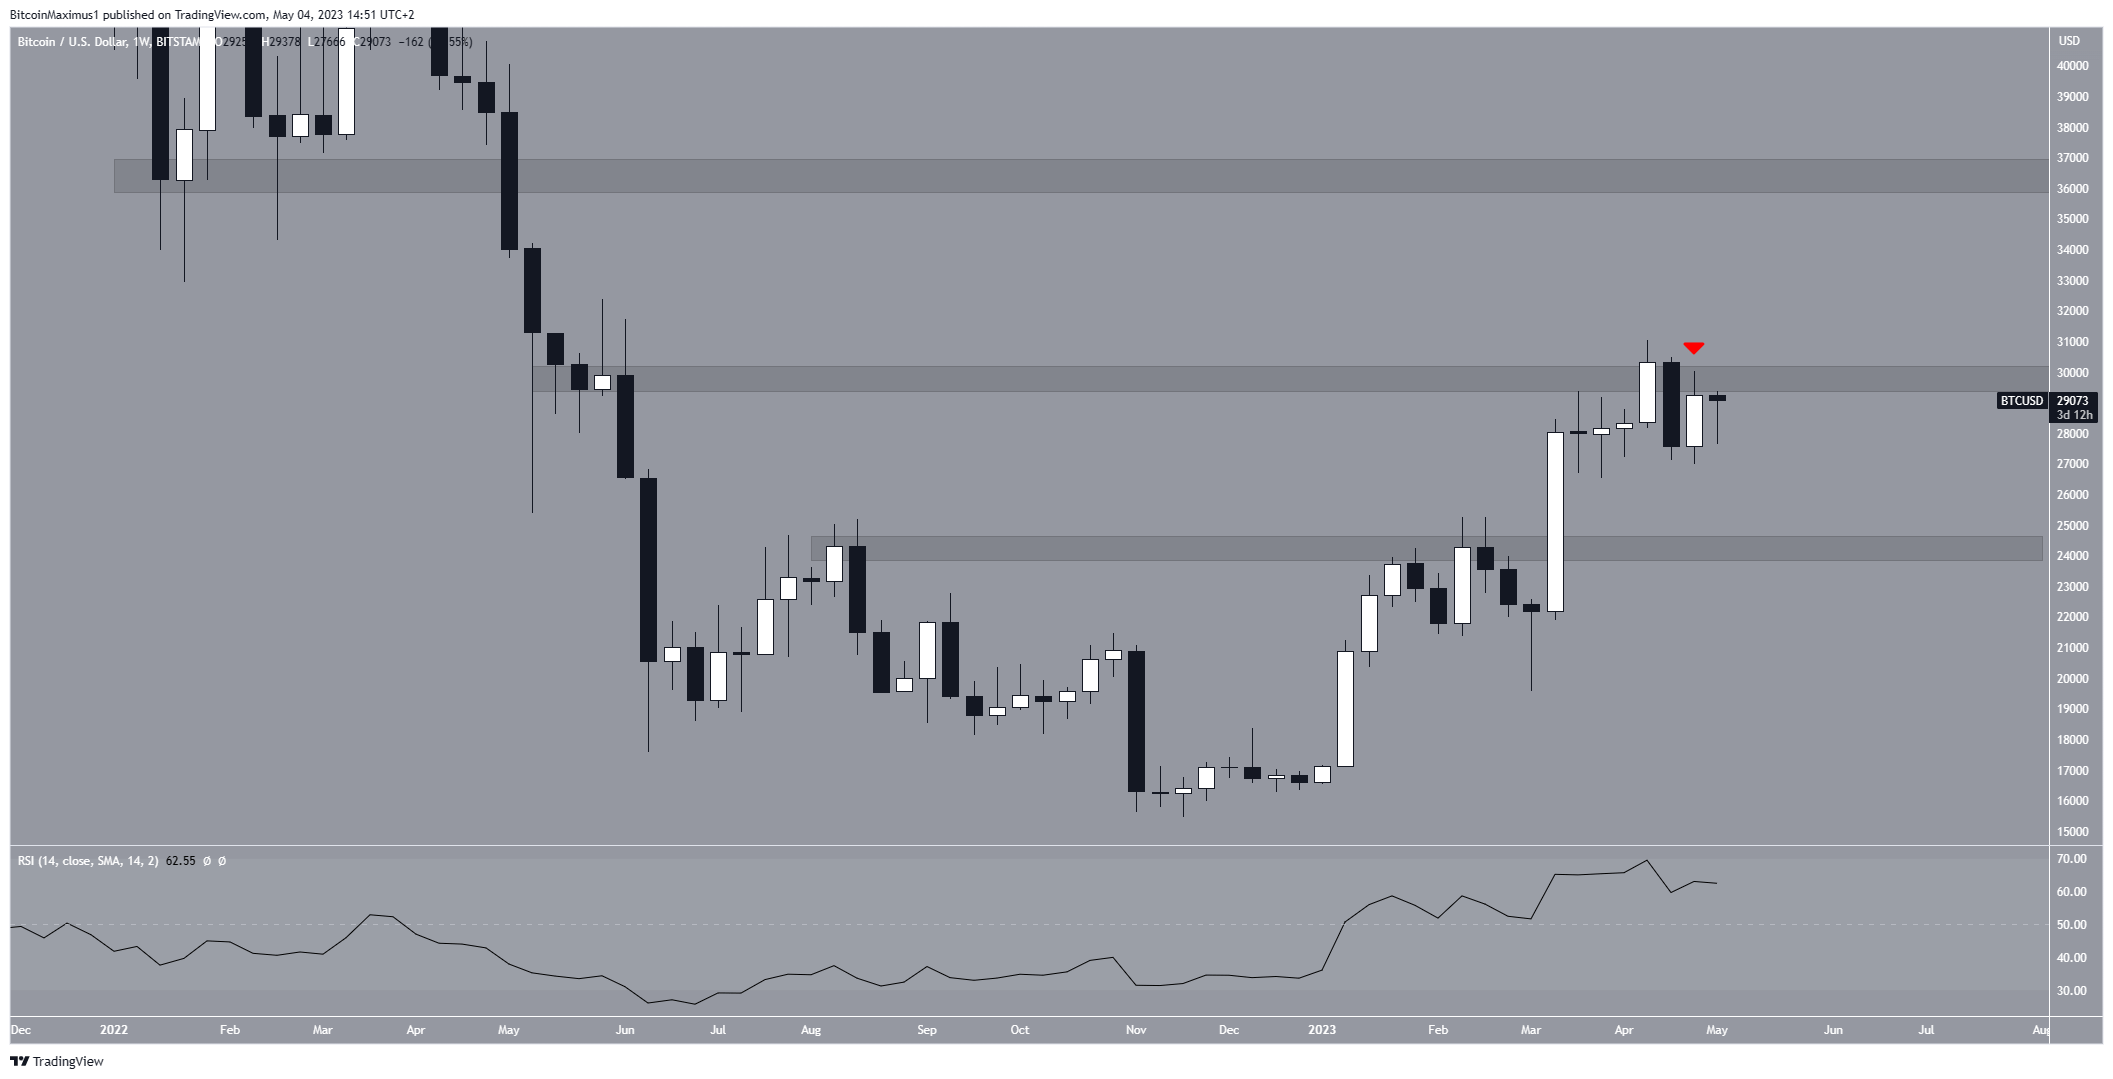
BTC/USD Weekly Chart. Source: TradingView
Despite these bearish signs, the weekly Relative Strength Index (RSI) remains positive, as it is above 50 and rising. Traders use the RSI to assess whether a market is overbought or oversold and decide whether to buy or sell an asset.
The bulls are in control if the RSI is above 50 and trending upwards. However, the opposite is true if the RSI falls below 50. It is worth noting that the number of average transactions hit a new record high last week.
The next closest resistance area is at $36,500, while the closest support is at an average price of $24,000.
Bitcoin Price Prediction: Does a Correction Await?
The technical analysis from the daily time frame provides a bearish Bitcoin price prediction. The main reason for this is that the price has created a head and shoulders, which is considered a bearish pattern.
The pattern consists of a peak that is higher than the ones preceding and succeeding it. Once the second one is finished, the price typically drops quickly, breaking the neckline.
If the potential price breakdown spans the entire pattern’s height (white), it will result in the digital asset dropping to $23,400. This aligns with the 0.5 Fib retracement support level (black).
According to the Fibonacci retracement levels principle, following a significant price change in one direction, the price is expected to partially retrace or go back to a previous price level before resuming in its original direction.
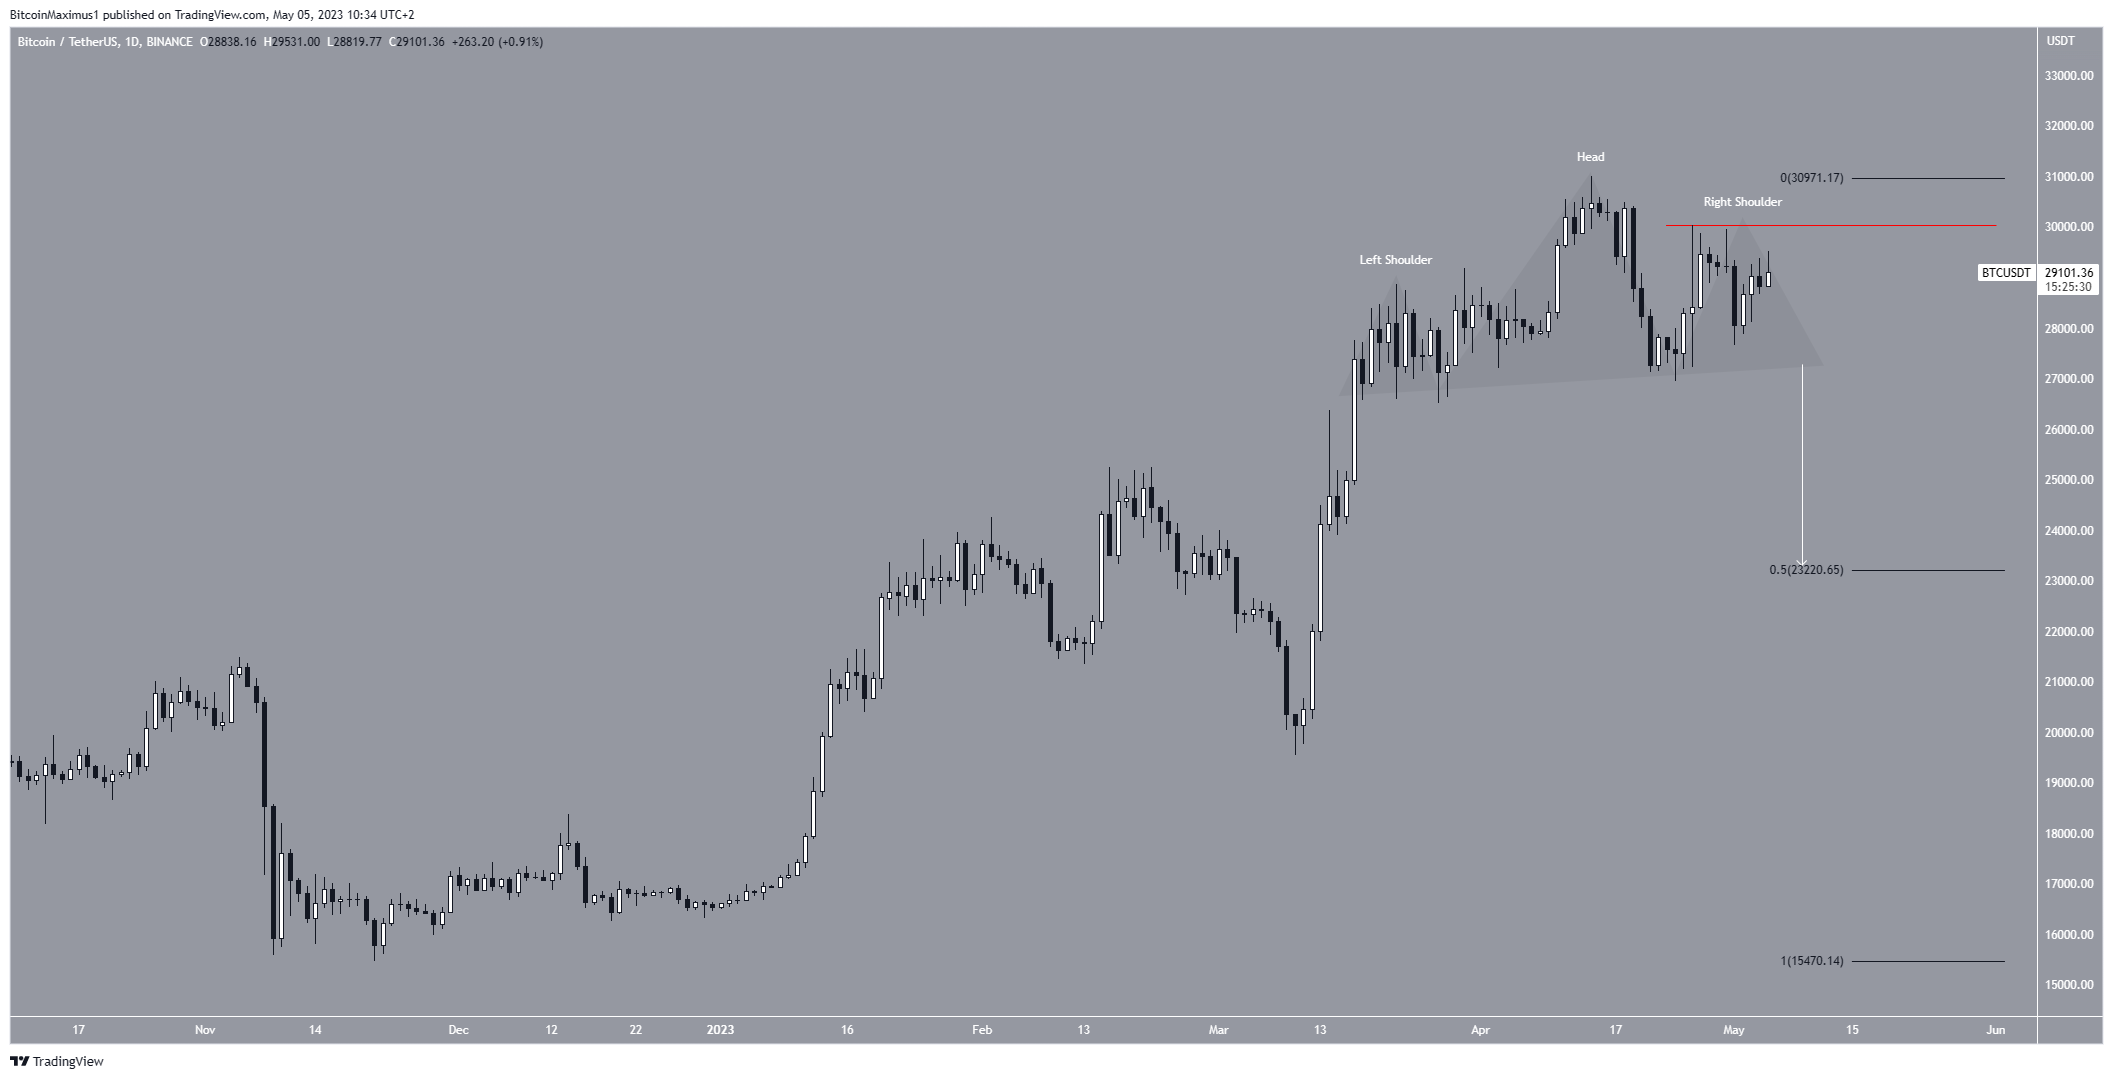
BTC/USDT Daily Chart. Source: TradingView
Despite this bearish Bitcoin price prediction, a movement above the right shoulder (red line) at $30,000 will mean that the trend is not bearish.
Rather, it could lead to an increase toward the next long-term resistance at $36,500.
For BeInCrypto’s latest crypto market analysis, click here.


 Bitcoin
  Ethereum
  Tether
  USDC
USDC  Dogecoin
  Cardano
  Bitcoin Cash
  Polygon
  Litecoin
  LEO Token
  Hedera
  Cosmos Hub
  Stellar
  OKB
OKB  Maker
Maker  Algorand
  NEO
NEO  Gate
Gate  KuCoin
  Synthetix Network
  IOTA
IOTA  Tether Gold
  TrueUSD
  Enjin Coin
  Holo
Holo  0x Protocol
  Ravencoin
  Siacoin
  Basic Attention
  Zcash
Zcash  Decred
  Ontology
  Lisk
Lisk  Waves
Waves  DigiByte
  Status
  Numeraire
  Nano
Nano  Pax Dollar
  Steem
Steem  OMG Network
  BUSD
BUSD  Ren
Ren  Bitcoin Diamond
  Bytom
Bytom  HUSD
HUSD  Energi
  Augur
Augur