


Can Chainlink (LINK) Price Reach $10 Under Current Crypto Market Conditions?

The Chainlink (LINK) price broke out from a descending wedge on Nov. 23. This could be a rally that will take it back to double digits.
The Chainlink price has traded close to $6.40 since May 9. While Chainlink reached a minimum price of $5.30, the lowest weekly close was at $5.80. Immediately after the close, the LINK price created a bullish engulfing candlestick (green icon).
The candlestick also validated a bullish divergence (green line) in the weekly time frame. This is the first time in the price history of Chainlink that the weekly RSI has generated bullish divergence.
However, the price movement is bearish, since Chainlink was rejected thrice (red icon) by the $9.40 horizontal resistance area.
As a result, the price action and the weekly RSI give an opposite outlook on the price forecast. While the RSI is bullish and suggests that the LINK price will successfully move above $8.90, the price action indicates that a fall toward the long-term $4.40 support area is expected.
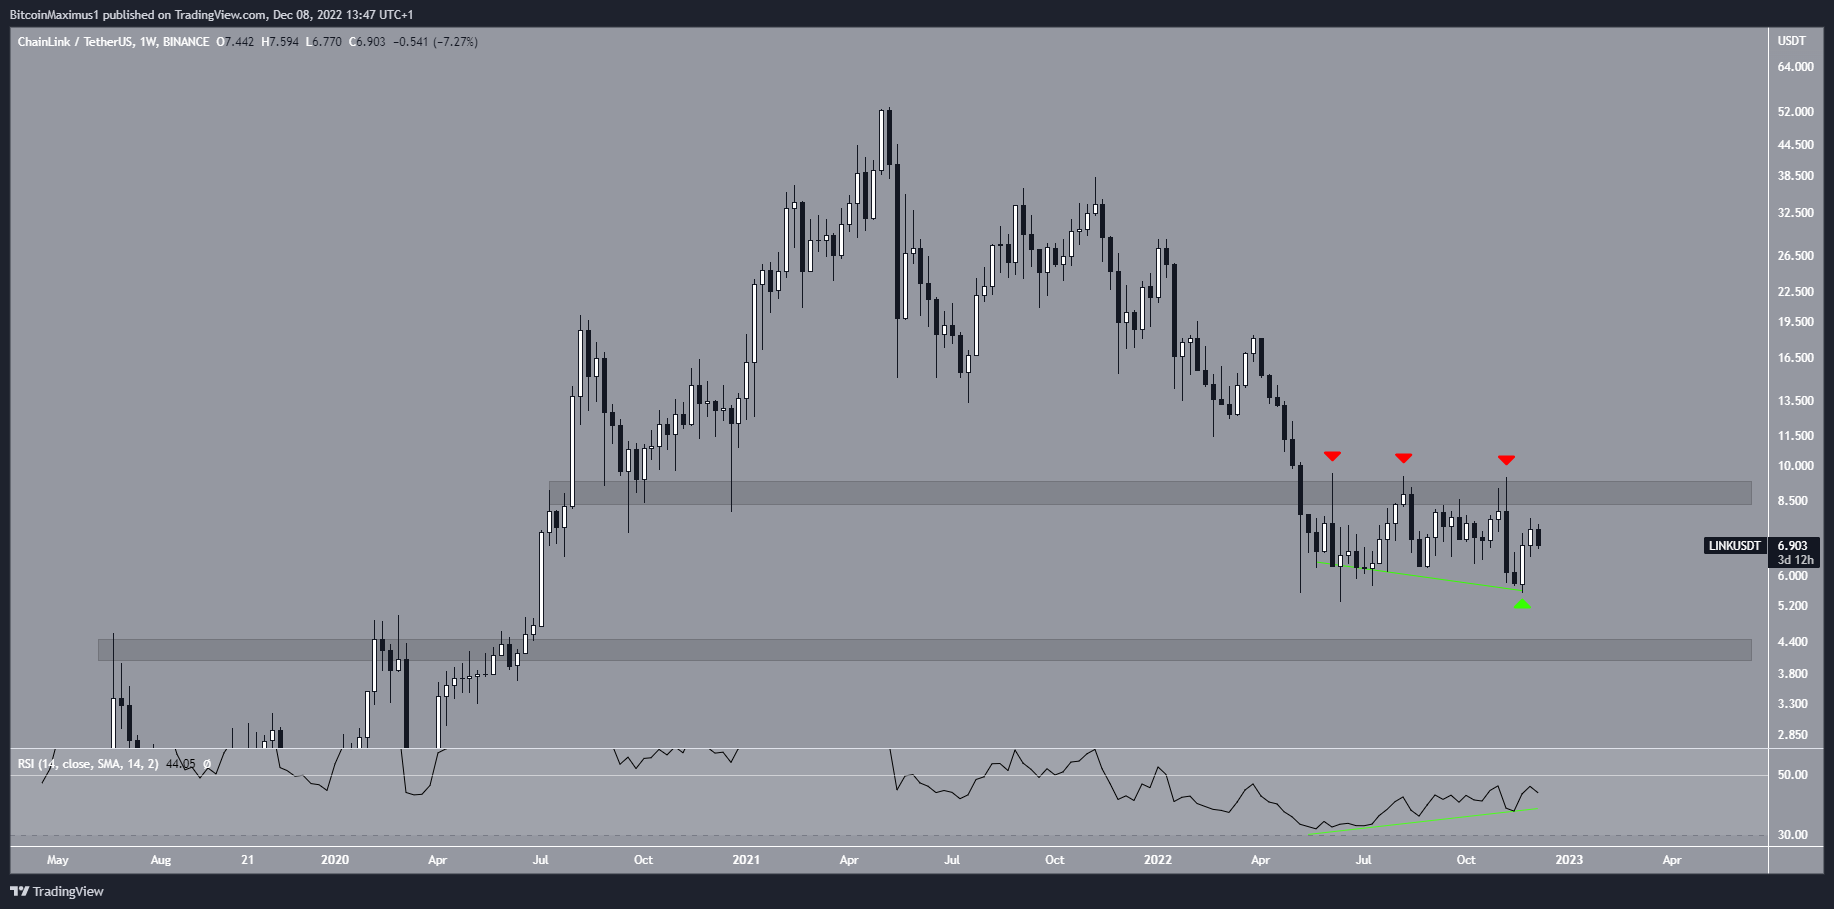
LINK/USDT Weekly Chart. Source: TradingView
Chainlink Price Wave Count Supports Eventual Breakout
The wave count provides a bullish price analysis, indicating that the future price will successfully move above the $9.40 resistance area. In turn, this would confirm the bullish divergence in the weekly RSI.
The most likely wave count suggests that the LINK price has completed an A-B-C corrective structure (black). In it, wave C developed into an ending diagonal, hence the shape of the wedge. The sub-wave count is given in white.
As a result, the most likely Chainlink price prediction is bullish. Conversely, falling below the wave C low (Red line) at $5.52 would invalidate this bullish forecast.
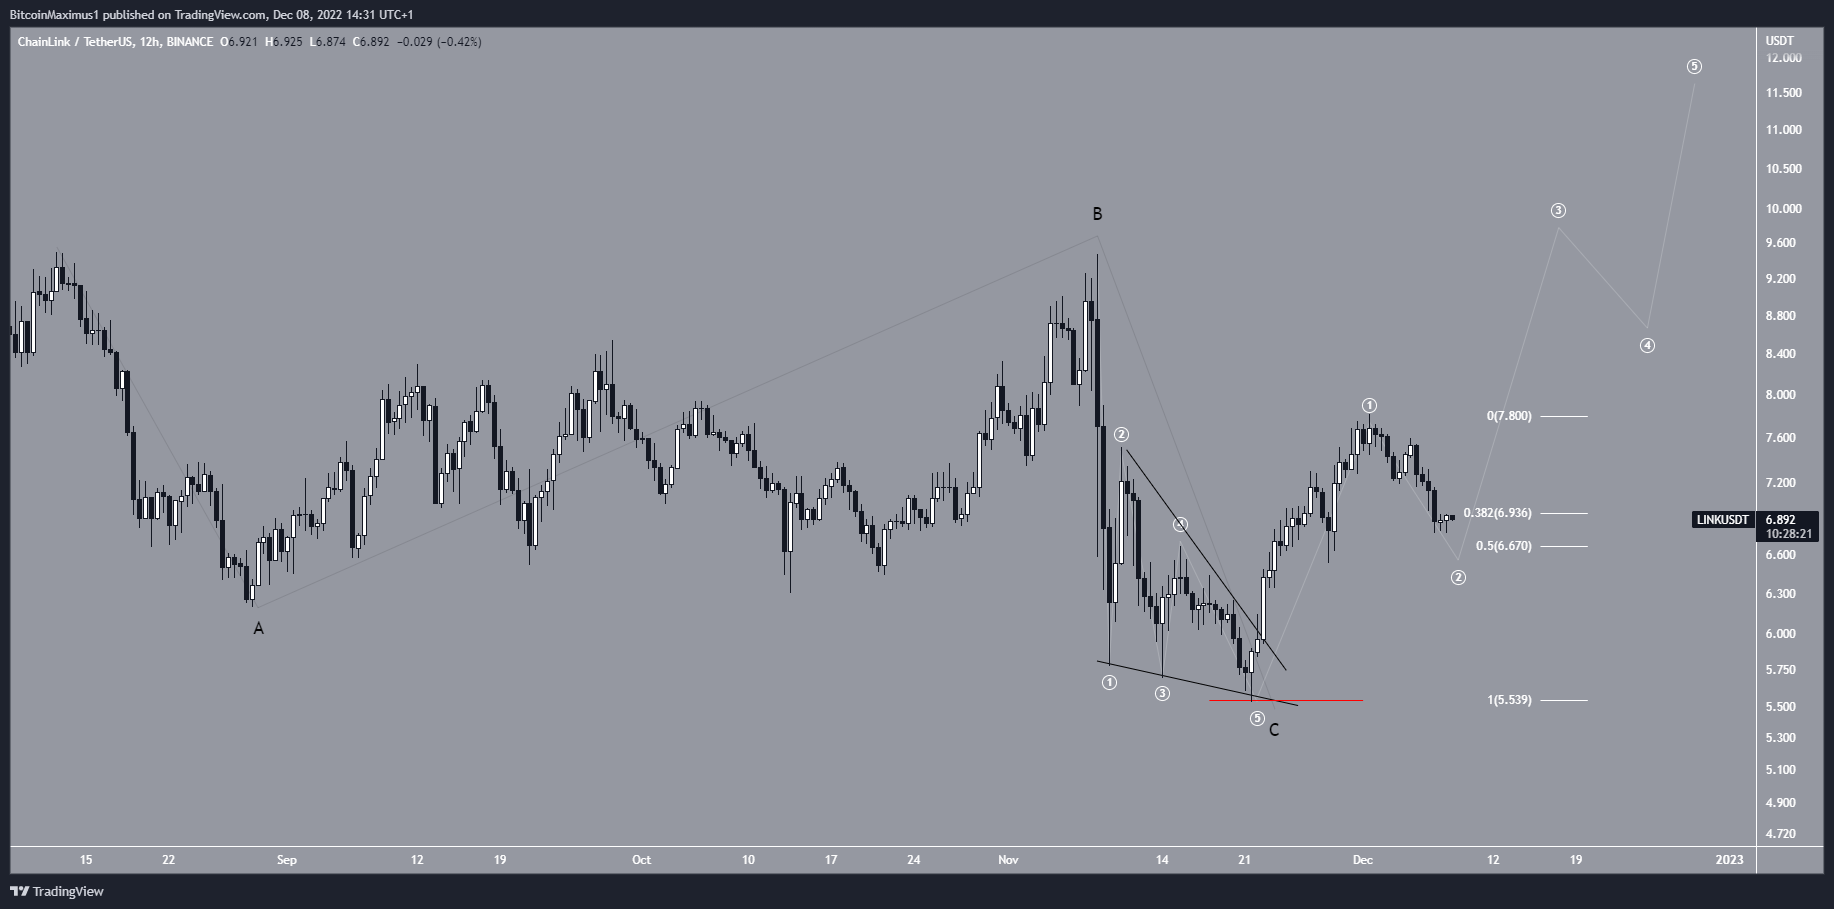
LINK/USDT Daily Chart. Source: TradingView


 Bitcoin
  Ethereum
  Tether
  USDC
USDC  Dogecoin
  Cardano
  Bitcoin Cash
  Polygon
  Litecoin
  LEO Token
  Hedera
  Stellar
  Cosmos Hub
  OKB
OKB  Maker
Maker  Algorand
  NEO
NEO  Gate
Gate  Synthetix Network
  KuCoin
  IOTA
IOTA  Tether Gold
  TrueUSD
  Holo
Holo  Enjin Coin
  Ravencoin
  0x Protocol
  Siacoin
  Basic Attention
  Ontology
  Zcash
Zcash  Decred
  Lisk
Lisk  Waves
Waves  DigiByte
  Status
  Numeraire
  Nano
Nano  Pax Dollar
  Steem
Steem  OMG Network
  BUSD
BUSD  Ren
Ren  Bytom
Bytom  Bitcoin Diamond
  HUSD
HUSD  Energi
  Augur
Augur