


Can Polygon (MATIC) Price Hit a New All-Time High Against Bitcoin (BTC)?

The Polygon (MATIC) price has created a short-term bullish pattern but is still trading below a critical resistance level.
Polygon is a Layer 2 scaling solution for the Ethereum blockchain. It effectively makes the Ethereum network an internet of blockchains. The platform focuses on decentralized applications and smart contracts. The native token for the Polygon network is MATIC.
The Polygon price has fallen since reaching a high of $1.30 on Nov. 5. On Dec. 17, the downward movement caused a breakdown from an ascending support line in place since Sept. 19. This is a bearish sign that suggests the upward trend might have come to an end.
However, the downward movement was not sharp because the MATIC price bounced at the $0.77 horizontal support area.
The daily RSI is neutral. While the indicator is increasing, it has not generated bullish divergence and is still below 50. As a result, the direction of the future trend is unclear.
A breakdown below $0.77 would likely lead to a fall toward the next support area at $0.62 while reclaiming the ascending support line could take the MATIC price above $1.
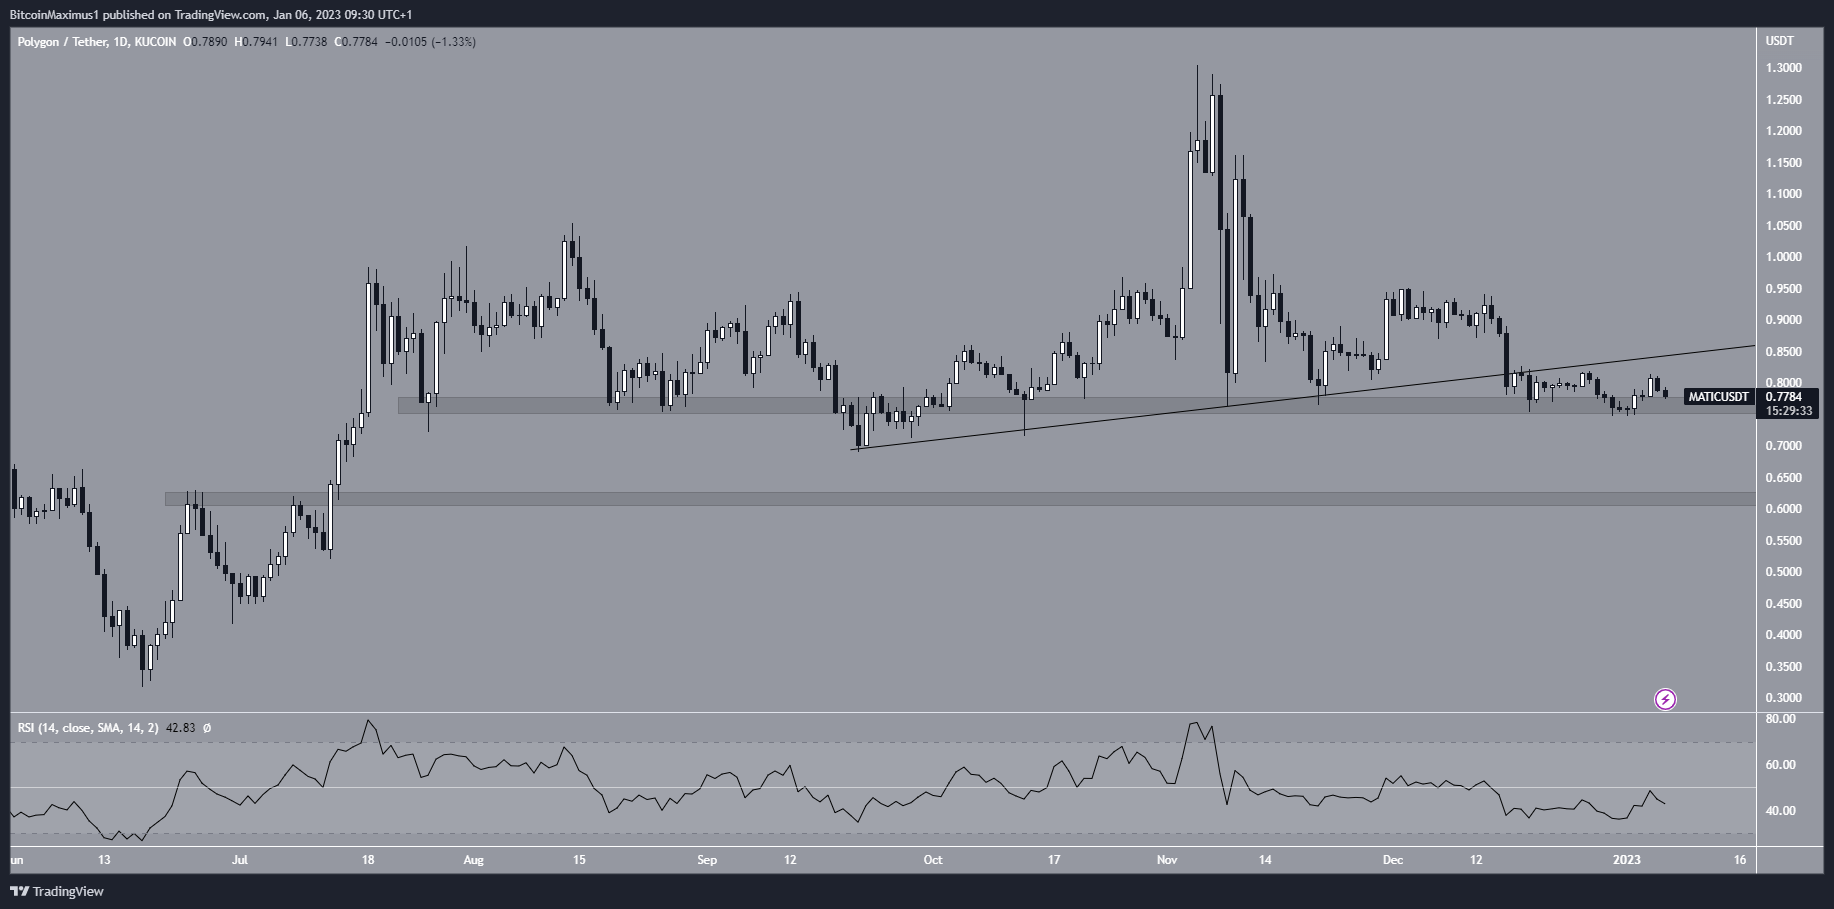
MATIC/USDT Daily Chart. Source: TradingView
Will Short-Term Polygon Bounce Occur?
The technical analysis from the six-hour time frame is more bullish, offering hope for a potential relief rally. The main reason for this is the double bottom pattern that has been combined with bullish divergence. The fact that the pattern is developing inside a support area further increases its legitimacy.
So, it is possible that an increase toward $0.86 will occur. However, the trend cannot be considered bullish until this line is reclaimed.
As outlined previously, a close below the $0.77 support area could catalyze a sharp fall toward $0.62.
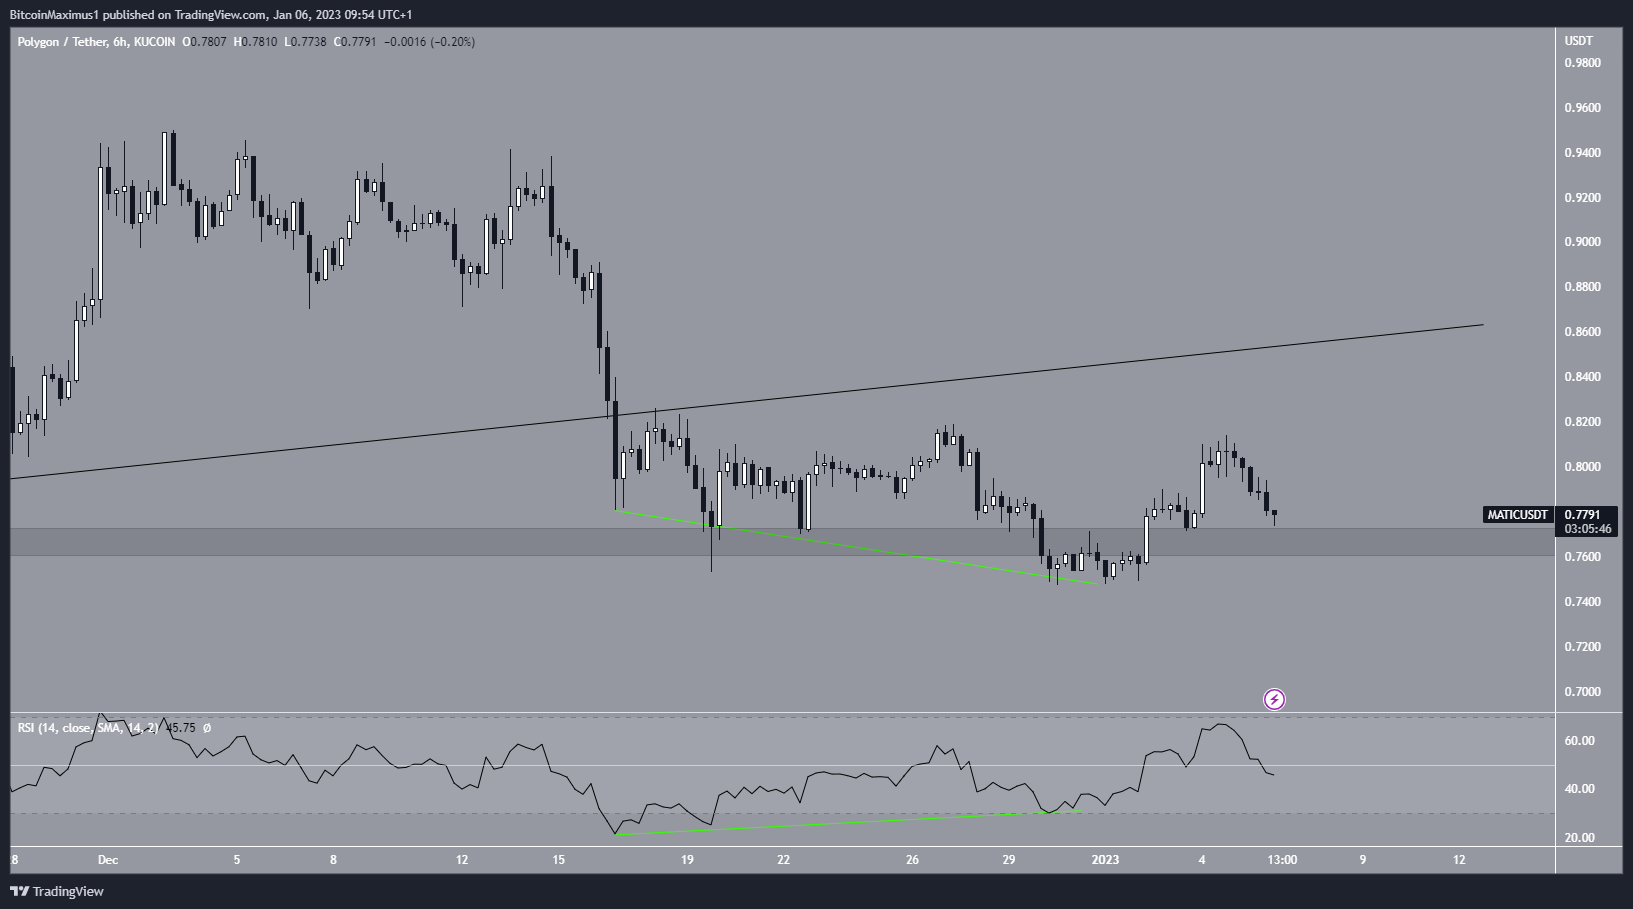
MATIC/USDT Six-Hour Chart. Source: TradingView
MATIC/BTC Barely Fails to Reach New All-Time High
The MATIC/BTC price has increased since June 2022, and barely failed to reach a new all-time high in November. The price reached a high of 66,060 Satoshis, slightly below the all-time high of 66,651 Satoshis. However, it reversed trend shortly after and has been falling since.
The downward movement validated the 57,000 Satoshi area as resistance and created a triple top (red icons) pattern in the weekly time frame. The triple top is considered a bearish pattern.
Moreover, the MATIC price broke down from an ascending support line that had been in place since the upward movement began in June. As a result, the most likely MATIC price analysis is the continuation of the downward movement toward the 38,000 and possibly 20,000 Satoshi support levels.
A weekly RSI decrease below 50 would confirm the validity of the breakdown and downward movement.
On the other hand, a weekly close above the 57,000 Satoshi resistance area would be expected to send the MATIC price to a new all-time high. Due to the outlined bearish readings, this seems unlikely.
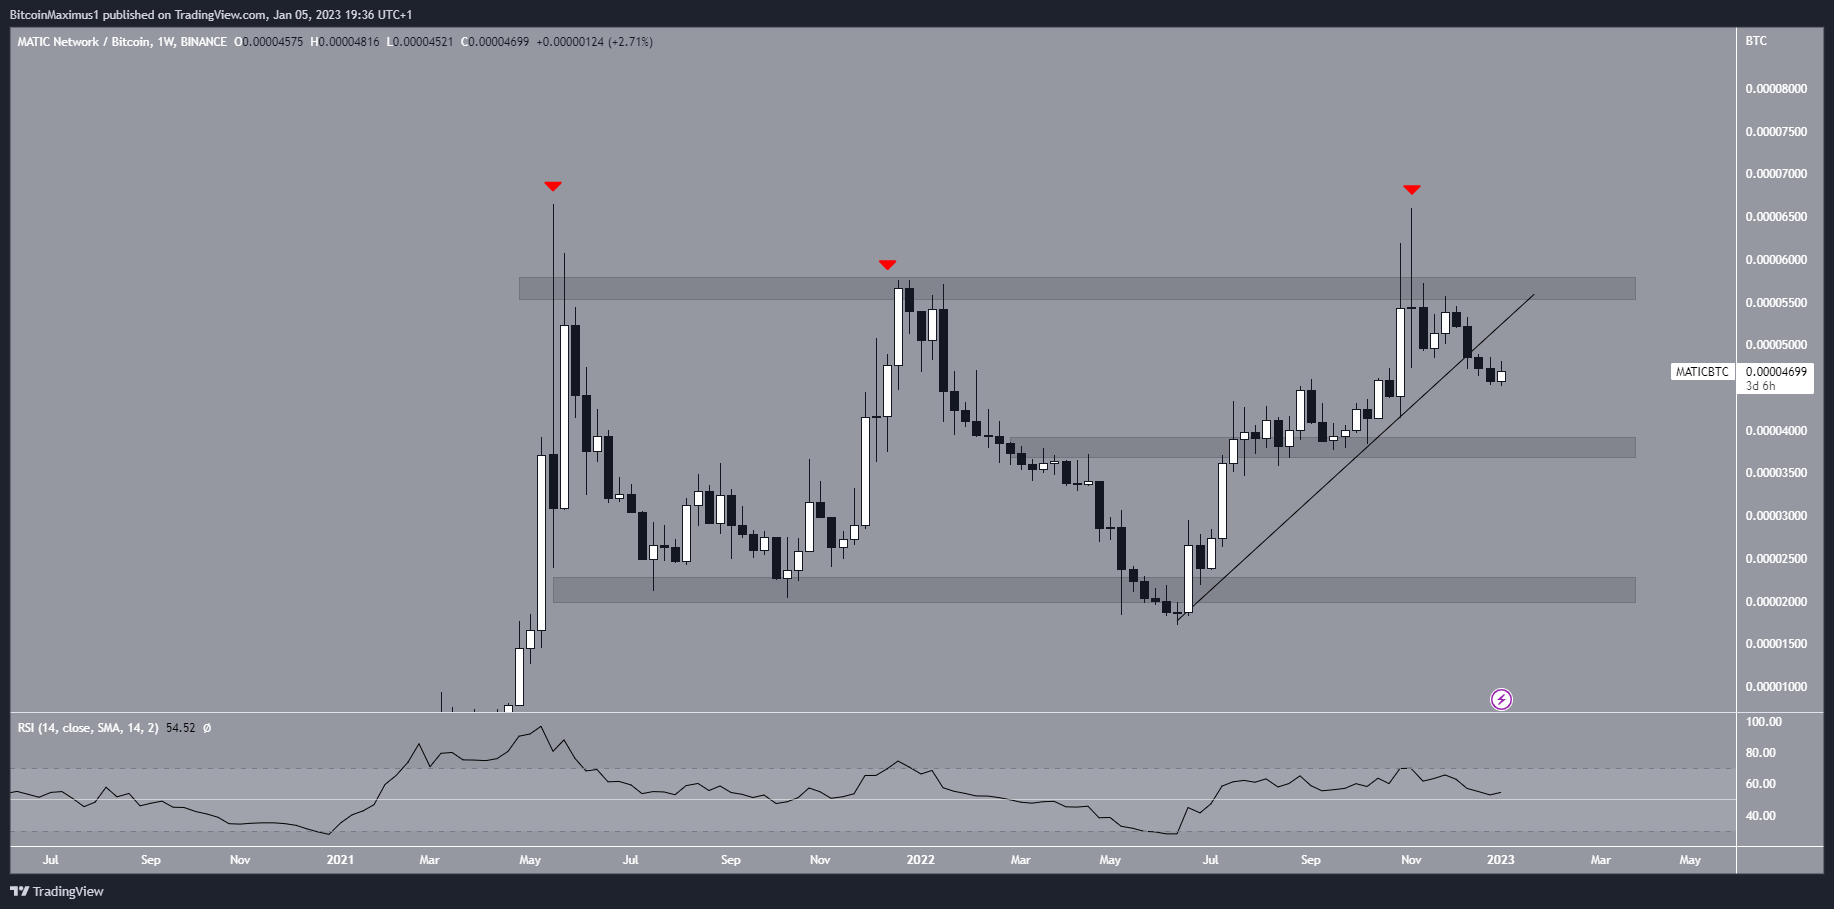
MATIC/BTC Weekly Chart. Source: TradingView
To conclude, the MATIC/USDT chart is considered bearish until the MATIC price reclaims the ascending support line from which it broke down. A close below the $0.77 area could trigger a rapid sharp fall.
Due to the creation of a bearish pattern, the MATIC/BTC chart is also considered bearish unless the 57,000 Satoshi area is reclaimed.


 Bitcoin
  Ethereum
  Tether
  USDC
USDC  Dogecoin
  Cardano
  Bitcoin Cash
  Polygon
  Litecoin
  LEO Token
  Hedera
  Stellar
  Cosmos Hub
  OKB
OKB  Maker
Maker  Algorand
  NEO
NEO  Gate
Gate  KuCoin
  Synthetix Network
  IOTA
IOTA  Tether Gold
  TrueUSD
  Holo
Holo  Enjin Coin
  0x Protocol
  Ravencoin
  Siacoin
  Basic Attention
  Ontology
  Zcash
Zcash  Decred
  Waves
Waves  Lisk
Lisk  DigiByte
  Nano
Nano  Status
  Numeraire
  Pax Dollar
  Steem
Steem  OMG Network
  BUSD
BUSD  Ren
Ren  Bytom
Bytom  Bitcoin Diamond
  HUSD
HUSD  Energi
  Augur
Augur