


Cardano (ADA) Price Had a Bad February, but Here’s Why March Will Be Even Worse

The Cardano (ADA) price shows bearish signs that could lead to a significant drop next month.
The ADA price has fallen since reaching an all-time high of $3.160 on Aug. 30. The downward movement led to a low of $0.239 in December.
The price has increased since it failed to move above the long-term resistance area at an average price of $0.400. This is a crucial horizontal level since it has intermittently acted as both resistance and support since 2018 (red and green icons).
Therefore, whether the price breaks out from it or gets rejected could determine the future trend’s direction. A breakout could lead to an increase to $0.65, while a rejection could lead to a fall toward $0.239.
The weekly RSI is increasing but is still below 50. Therefore, more is needed to determine the future price action.
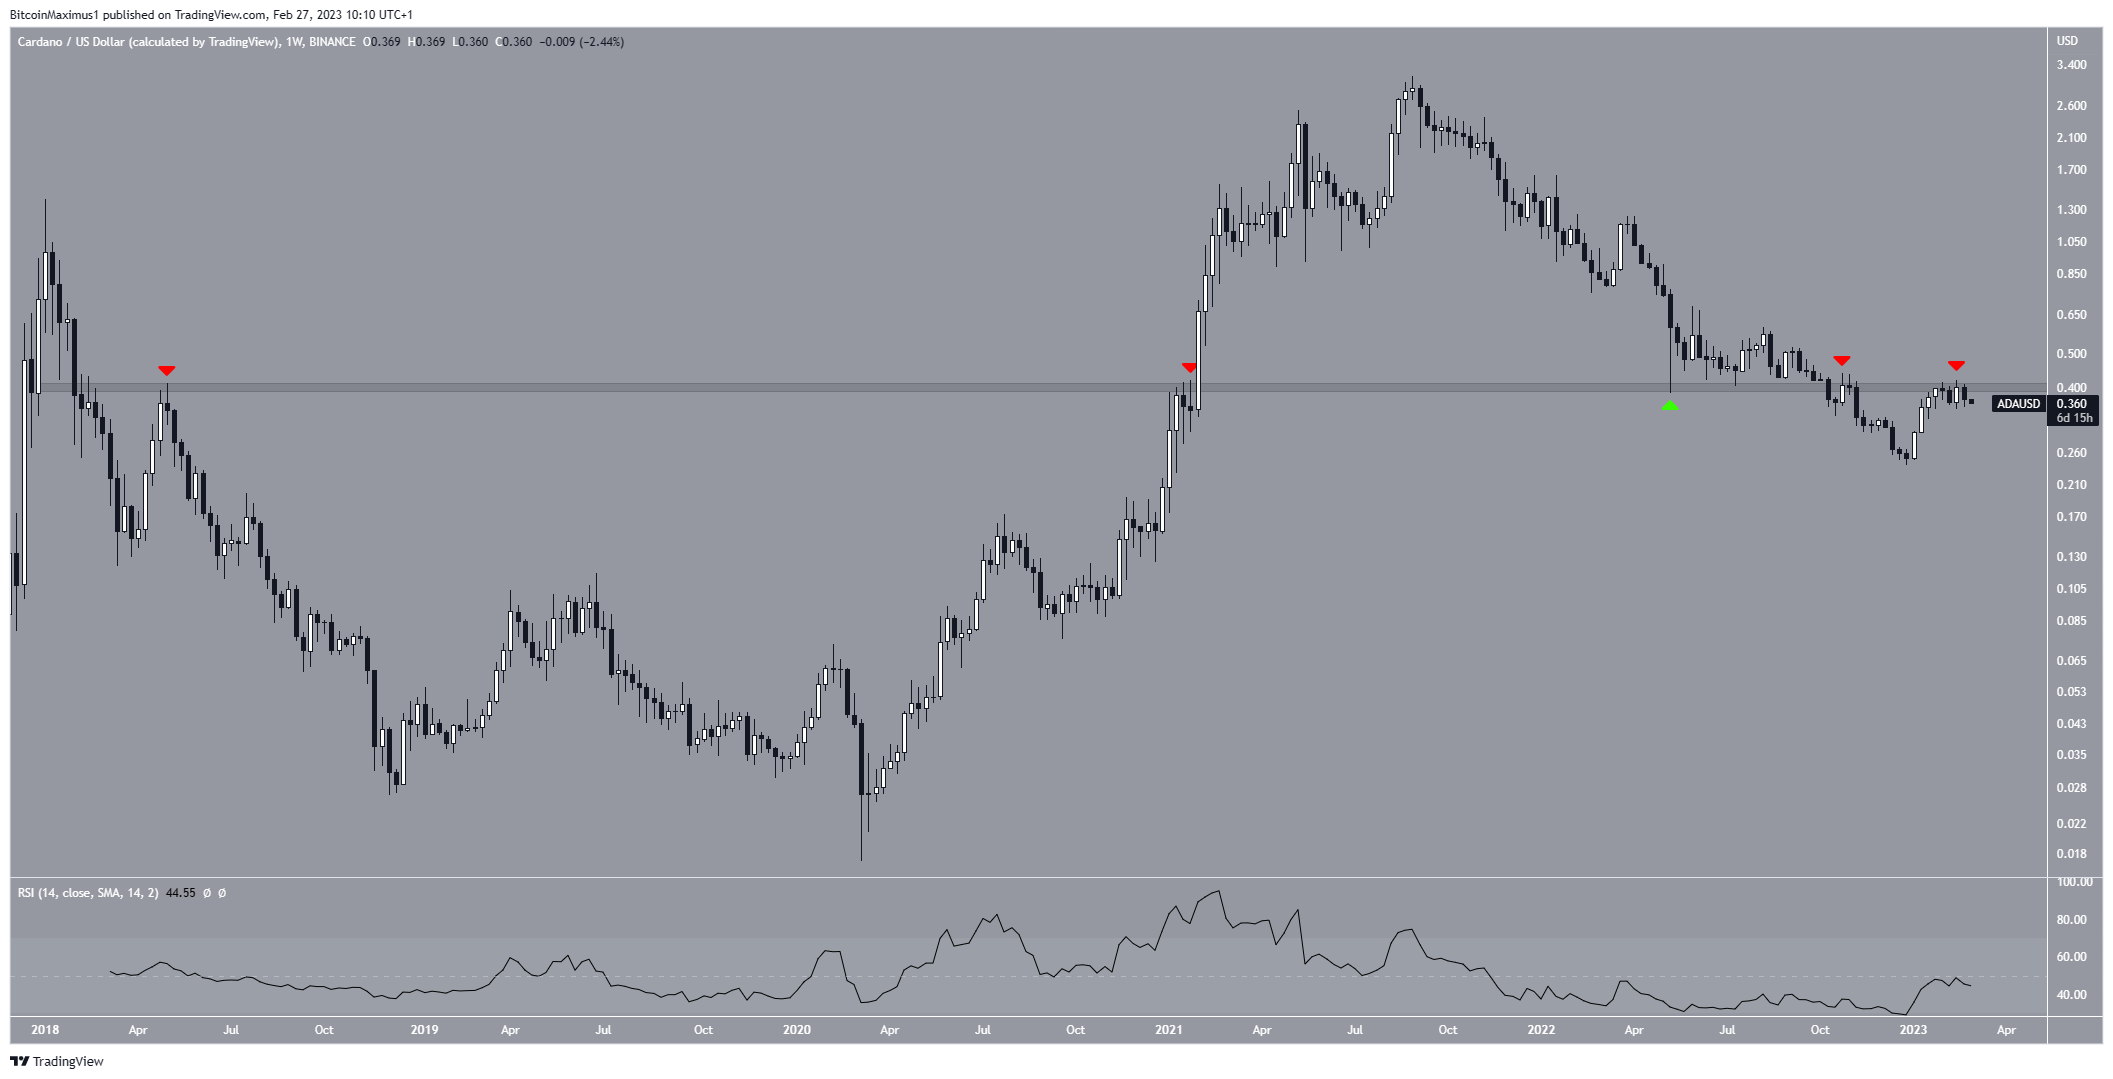
ADA/USD Weekly Chart. Source: TradingView
Cardano (ADA) Price Prediction for March
The short-term technical analysis from the 12-hour chart provides a more bearish outlook. The price broke down from an ascending support line and validated it as resistance afterward (red icon). Moreover, it fell below the $0.405 resistance area.
Currently, the price is trading above the $0.35 horizontal and Fib support level. If it breaks down, the ADA price could fall to the 0.618 Fib level at $0.307.
Therefore, the Cardano price forecast is considered bearish until the ADA price moves above the long- and short-term resistance at $0.405.
The RSI is slightly below 50, thus also leaning on a bearish trend.
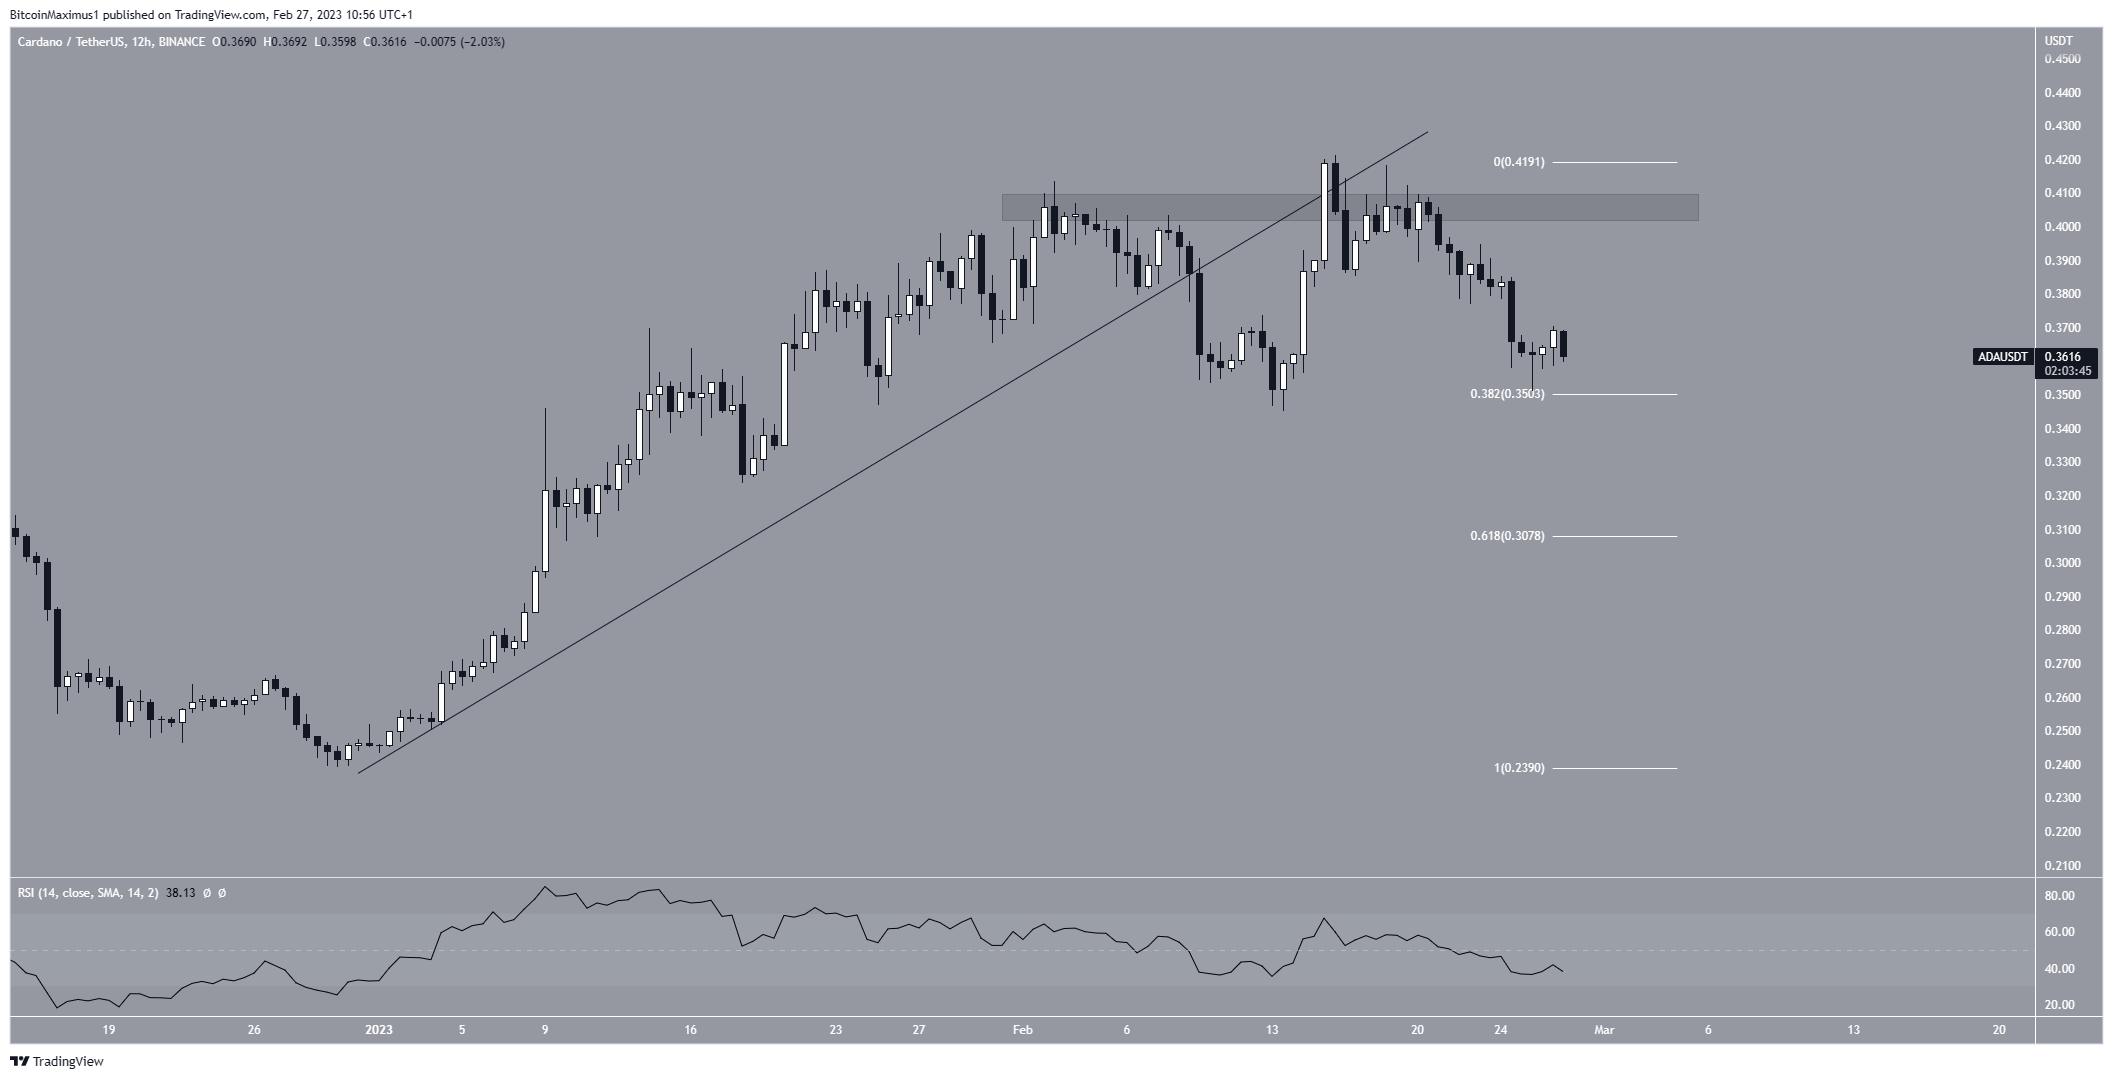
ADA/USDT Two-Hour Chart. Source: TradingView
The wave count can help determine the direction of the future movement. There are currently two possibilities.
The bearish one suggests that the price is in wave four of a five-wave downward movement (red). In this case, the ensuing drop would lead to a breakdown.
The bullish one suggests the price has just completed an A-B-C correction (black). In this case, it will increase soon.
The bullish count would be confirmed by an increase above $0.385 (green line), while the bearish one would be confirmed by a drop below $0.345 (red line)
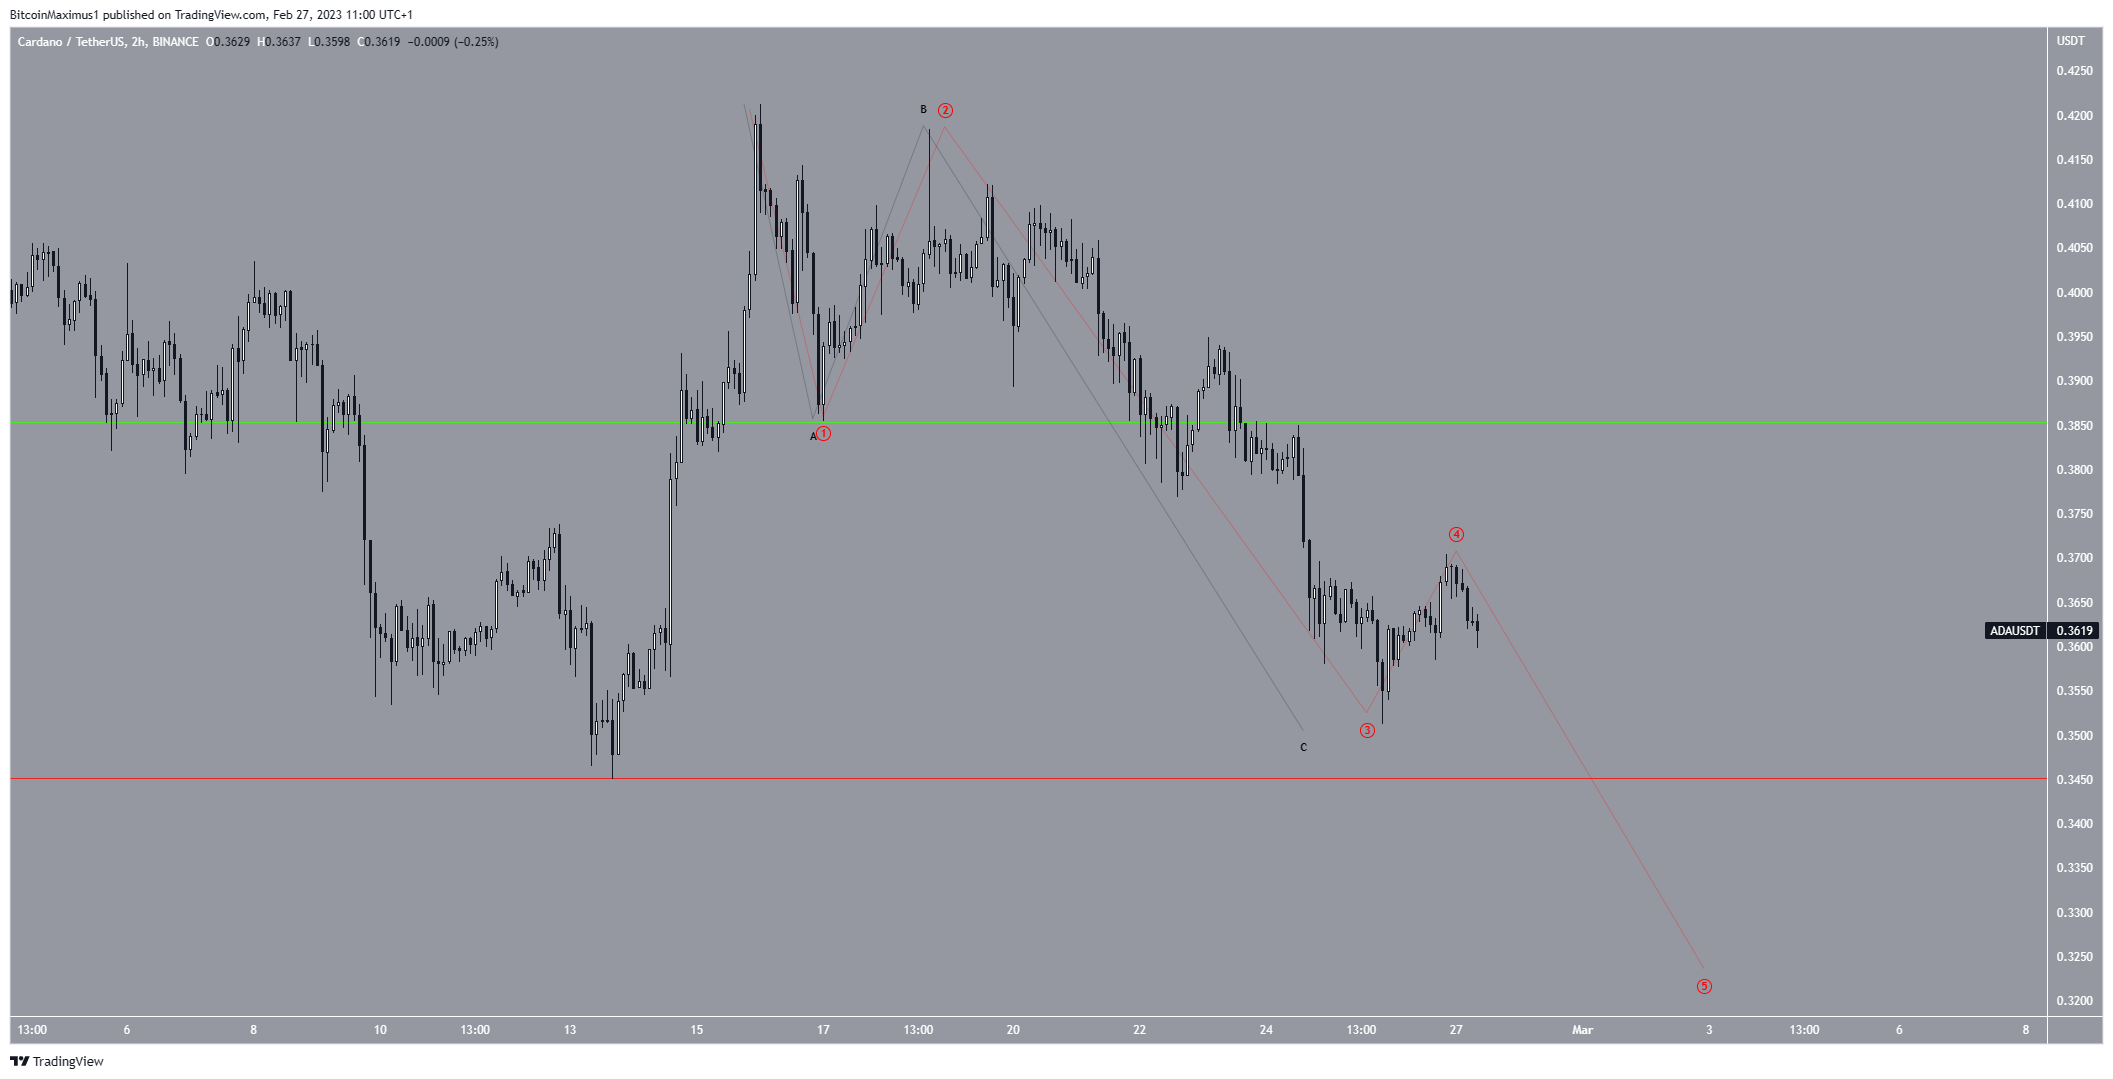
ADA/USDT Two-Hour Chart. Source: TradingView
To conclude, the most likely Cardano price forecast is a decrease toward $0.307. On the other hand, an increase above $0.385 would invalidate this bearish analysis and could lead to a retest of the $0.405 resistance.


 Bitcoin
  Ethereum
  Tether
  USDC
USDC  Dogecoin
  Cardano
  Bitcoin Cash
  Polygon
  Litecoin
  LEO Token
  Hedera
  Cosmos Hub
  Stellar
  OKB
OKB  Maker
Maker  Algorand
  NEO
NEO  Gate
Gate  KuCoin
  Synthetix Network
  IOTA
IOTA  Tether Gold
  TrueUSD
  Enjin Coin
  Holo
Holo  0x Protocol
  Ravencoin
  Siacoin
  Basic Attention
  Zcash
Zcash  Decred
  Ontology
  Lisk
Lisk  Waves
Waves  DigiByte
  Status
  Nano
Nano  Numeraire
  Pax Dollar
  Steem
Steem  OMG Network
  BUSD
BUSD  Ren
Ren  Bitcoin Diamond
  Bytom
Bytom  HUSD
HUSD  Energi
  Augur
Augur