Cardano price analysis: ADA drives past $0.500, aims for $0.533 next

The Cardano price analysis is showing an improvement in the coin value. Cardano‘s price is continuing upwards movement after yesterday’s bullish flight and the price levels have overcome the exceeding bearish momentum, and coin has achieved the value of $0.519. The bulls have been able to lead again after the bears tried making a comeback. The momentum has been considerable and may take the price even further high if it gains more strength.
ADA/USD 1-day price chart: Bullish impact hightens coin value
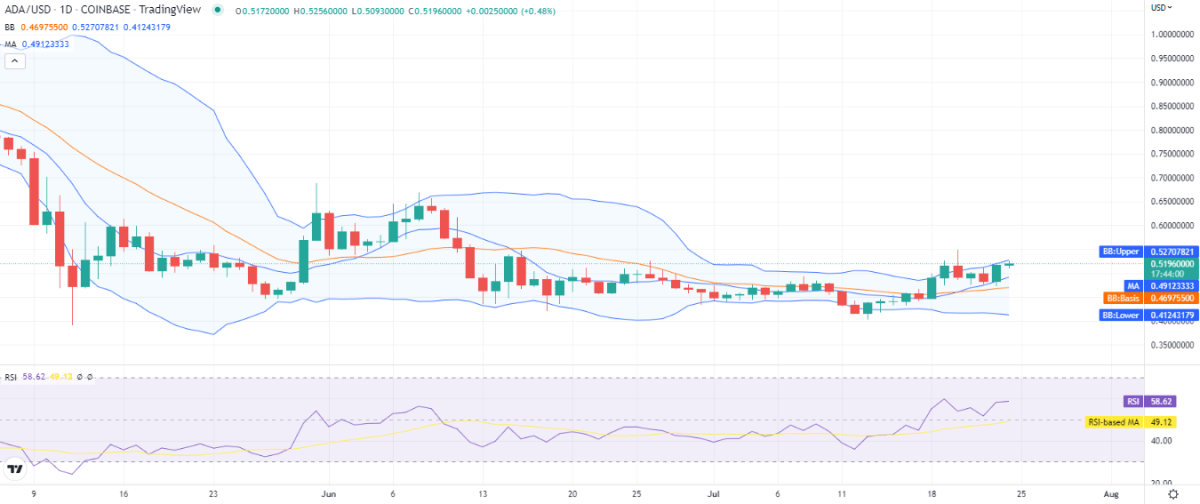
In the 1-day price chart for Cardano price analysis shows that a further increase in the cryptocurrency price levels has been noticed, as the bulls are trying constantly to win back their position. green candlesticks have appeared on the chart, with the price increasing to $0.519. This is an encouraging notion for the buyers, as the price levels have increased after a smooth bullish trend.
ADA/USD 1-day price chart. Source: TradingView
The moving average (MA) however, is below the current price level, i.e., $0.491. The volatility is increasing, from which we can expect a rise in price ahead. The Bollinger bands show an average of $0.469, and the trending line is showing stability. The Bollinger bands are showing the following values; the upper band is at $0.527 representing the resistance, whereas the lower band is present at $0.412 representing the support, in the daily chart.
The Relative Strength Index (RSI) score is at a very good number and is currently at index 58. The indicators curve is almost flat which hints at resistance from the bearish side.
Cardano price analysis: Recent developments and further technical indications
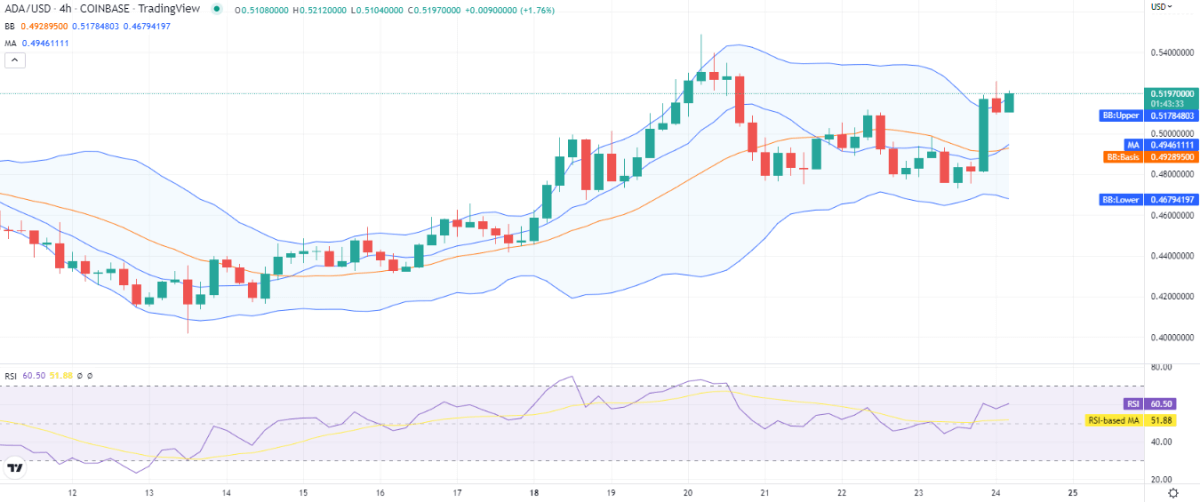
The 4-hour chart for Cardano rice analysis is showing a gradual rise in the price after the bulls took took the lead back in the last four hours. The momentum has been strong enough to take the price above $0.516. The last few days have seen a shocking drop in the price levels, after which bulls have carried out a strong competition. Bears causwed a correction at the start of today’s trading session as well, but bulls have recovered the recent loss.
ADA/USD 4-hour price chart. Source: TradingView
The moving average (MA) is present at $0.517, below the current price value. The volatility is increasing for the cryptocurrency. The Bollinger bands have been showing the following values; the upper band has gone up to $0.517 whereas the lower band shows a $0.467 value. The RSI score is 60 at present which is a highly neutral figure for cryptocurrency and its upwards curve is indicating the buying activity in the market.
Cardano price analysis conclusion
The Cardano price analysis is showing positive news for the buyers. The bulls seem to be regaining their strength as they have successfully climbed up to $0.519. The market is supposed to exhibit identical results in the future if the support persists. The resistance level found at $0.533 can only be overcome in that scenario.
Disclaimer. The information provided is not trading advice. Cryptopolitan.com holds no liability for any investments made based on the information provided on this page. We strongly recommend independent research and/or consultation with a qualified professional before making any investment decisions.




 Bitcoin
  Ethereum
  Tether
  USDC
USDC  TRON
TRON  Dogecoin
  Cardano
  Bitcoin Cash
  Chainlink
  Monero
  LEO Token
  Stellar
  Zcash
Zcash  Litecoin
  Hedera
  Dai
Dai  Cronos
  Tether Gold
  OKB
OKB  Ethereum Classic
  KuCoin
  Cosmos Hub
  Gate
Gate  Algorand
  VeChain
  Stacks
  Tezos
Tezos  TrueUSD
  Dash
Dash  IOTA
IOTA  Basic Attention
  Theta Network
  Decred
  NEO
NEO  Synthetix
  Qtum
Qtum  Ravencoin
  0x Protocol
  DigiByte
  Zilliqa
  Nano
Nano  Siacoin
  Numeraire
  Waves
Waves  Status
  Ontology
  Enjin Coin
  Hive
Hive  BUSD
BUSD  Pax Dollar
  Lisk
Lisk  Steem
Steem  Huobi
Huobi  OMG Network
  NEM
NEM  Bitcoin Gold
  Augur
Augur  Bitcoin Diamond