Chainlink Faces Rejection at $7.23 High, May Resume Selling Pressure

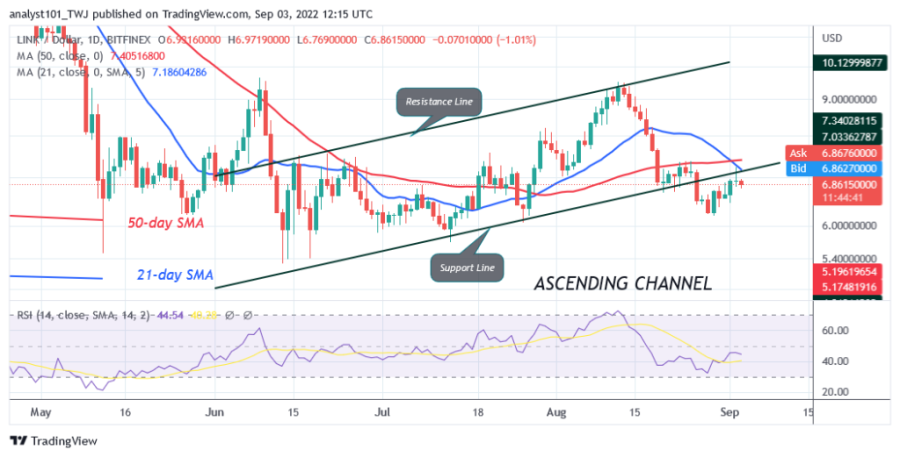
The price of Chainlink (LINK) is in a downward correction as the altcoin faces another rejection at the 21-day line SMA. Since August 28, the price of LINK has been in an upward correction. The upward movement was terminated at the 21-day moving average line.
If buyers keep the price above the moving average lines, the altcoin will rise to the high of $9.50. Conversely, Chainlink will fall to the previous low of $6.20. However, if the bears break below the current support, the market will continue to fall to $5.70 or $5.40. In the meantime, Chainlink is trading at $6.85 at the time of writing.
Chainlink indicator reading
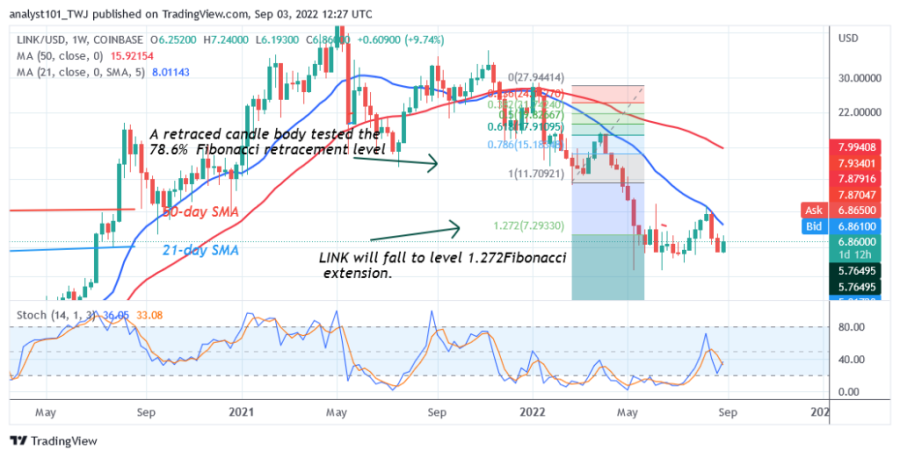
Chainlink is at level 44 on the Relative Strength Index for period 14. LINK is in a downtrend as it faces another rejection at the moving average lines. The price bars are below the moving average, indicating a further decline. The altcoin is below the 40% area of the daily stochastic. This indicates that the market is in a bearish momentum.

Technical indicators
Key Resistance Zones: $10, $12, $14
Key Support Zones: $9, $7, $5
What is the next move for Chainlink?
Chainlink is likely to see another decline as it faces rejection at the moving average lines. On the weekly chart, a candlestick tested the 78.6% Fibonacci retracement level on March 28. The retracement suggests that LINK will fall to the Fibonacci extension level of $1.272 or to $7.29.

Disclaimer. This analysis and forecast are the personal opinions of the author and are not a recommendation to buy or sell cryptocurrency and should not be viewed as an endorsement by Coin Idol. Readers should do their own research before investing in funds.


 Bitcoin
  Ethereum
  Tether
  USDC
USDC  TRON
TRON  Dogecoin
  Cardano
  Bitcoin Cash
  Zcash
Zcash  Chainlink
  LEO Token
  Monero
  Stellar
  Litecoin
  Hedera
  Dai
Dai  Cronos
  Tether Gold
  OKB
OKB  Ethereum Classic
  KuCoin
  Gate
Gate  Algorand
  Cosmos Hub
  VeChain
  Dash
Dash  Tezos
Tezos  TrueUSD
  Stacks
  IOTA
IOTA  Decred
  Basic Attention
  Theta Network
  NEO
NEO  0x Protocol
  Synthetix
  Qtum
Qtum  Ravencoin
  DigiByte
  Zilliqa
  Nano
Nano  Siacoin
  Numeraire
  Waves
Waves  Ontology
  Status
  BUSD
BUSD  Hive
Hive  Enjin Coin
  Pax Dollar
  Lisk
Lisk  Steem
Steem  Huobi
Huobi  OMG Network
  NEM
NEM  Bitcoin Gold
  Augur
Augur  Ren
Ren