


FTM Technical Analysis: Despite Recent Bull, Fantom Fails to Reach $0.025

The FTM technical analysis displays a sideways uptrend after a bullish breakout with 200-day EMA far below the price line. Fantom (FTM) has delivered a tremendous growth of 29.5% over the last 14 days following a market crash due to the FTX controversy when FTM plunged to the low of $0.16. Since then the token has been in recovery mode. With a spike of 13.7%, the token’s market cap rose by 11.83% to $560.82 in the last 24 hours. The jump of 11.38% in the trading volume to $160.30 million complemented by the price rise, reflects substantial demand in the market.
Key Points
- The FTM price action shows sideways upward momentum after the recent bull cycle
- The price line moving above the 200-day EMA still shows bullish in the market
- The intraday trading volume in FTM is $160.30 million
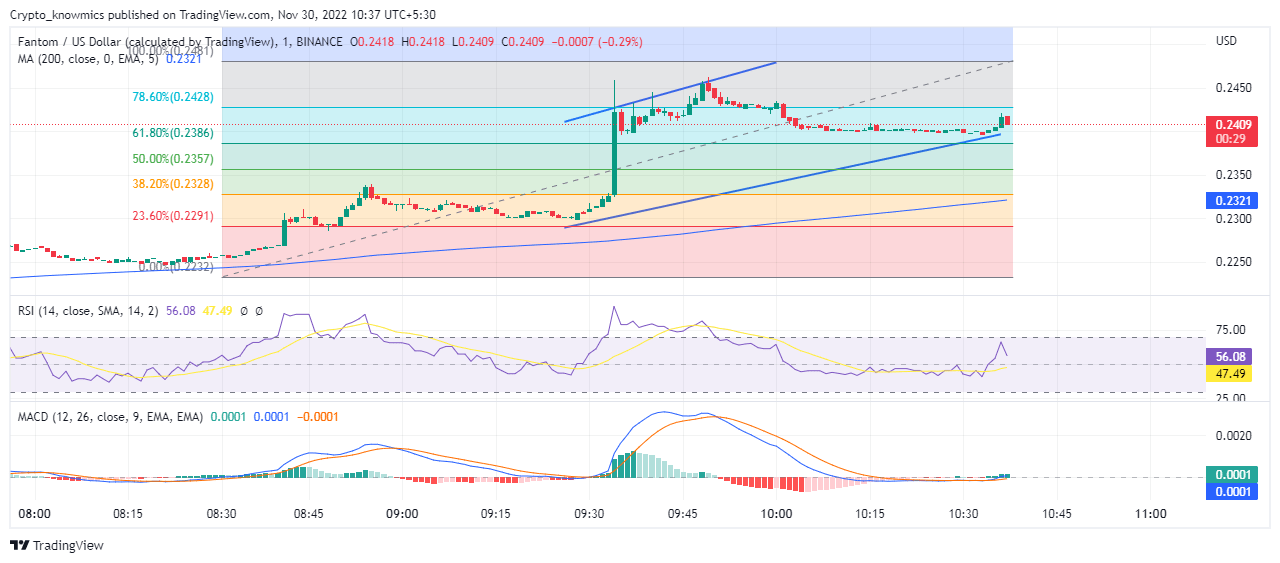
Source: Tradingview
FTM Technical Analysis
After FTM plunged to the low of $0.16, the token has been at the forefront to recover from the recent crash. With a remarkable rise of 37.8%, the coin has recovered steadily in the last 7 days, with a high of touching $0.24. The daily chart shows that after a recent slash the token has again taken the path of bullish reversal while challenging the 200-day EMA. Although the recent bull has cooled down, the movement of the price above 61.80% on the Fibonacci retracement level shows positive signs. If FTM manages to prolong the recovery rally, every rally price can break above $0.25, whereas if the reversal rally fails the token can again plunge beyond $0.17. Sidelined traders can still make an option to book the profits if prices show some stability.
Technical Indicators
The RSI after diving from the overbought zone moves sideways along the halfway line showing the balance between demand and supply, diving down despite giving a bullish divergence. Bottom-out MACD and the signal line are choppy on the bullish histogram signaling another round of upswing. The technical indicators display a slowdown in the bullish momentum due to low buying pressure in the market despite MACD showing some relief.


 Bitcoin
  Ethereum
  Tether
  USDC
USDC  Dogecoin
  Cardano
  Bitcoin Cash
  Polygon
  Litecoin
  LEO Token
  Hedera
  Cosmos Hub
  Stellar
  OKB
OKB  Maker
Maker  Algorand
  NEO
NEO  Gate
Gate  KuCoin
  Synthetix Network
  IOTA
IOTA  Tether Gold
  TrueUSD
  Enjin Coin
  Holo
Holo  Ravencoin
  0x Protocol
  Siacoin
  Basic Attention
  Zcash
Zcash  Decred
  Ontology
  Lisk
Lisk  Waves
Waves  DigiByte
  Nano
Nano  Numeraire
  Status
  Pax Dollar
  Steem
Steem  OMG Network
  BUSD
BUSD  Ren
Ren  Bitcoin Diamond
  Bytom
Bytom  HUSD
HUSD  Energi
  Augur
Augur