


Chainlink (LINK) Price Perilously Close to Breaking Down from Support Line
The Chainlink (LINK) price has bounced for the fifth time at an ascending support line that has been in place for 223 days.
The LINK token is the native token of the Chainlink network, a decentralized oracle network that deals with smart contracts. The LINK price has reached a long-term diagonal support level. Whether it breaks down from it or bounces could determine the direction of the future trend.
Chainlink Price Bounces at Ascending Support
The technical analysis from the daily time frame shows that the LINK price has increased alongside an ascending support line since May 7. The line has caused five bounces so far, the most recent on Dec. 19. The Chainlink price created a bullish engulfing candlestick the next day.
Despite the bullish candlestick, the daily RSI is bearish. It is decreasing, is below 50, and has not generated any bullish divergence.
Furthermore, the Chainlink price is approaching the support line once more. Since lines get weaker each time they are touched, this could mean a breakdown is forthcoming. If one occurs, the rate of decrease could greatly accelerate. However, in case of a reversal, the main resistance area would be at $9.50.
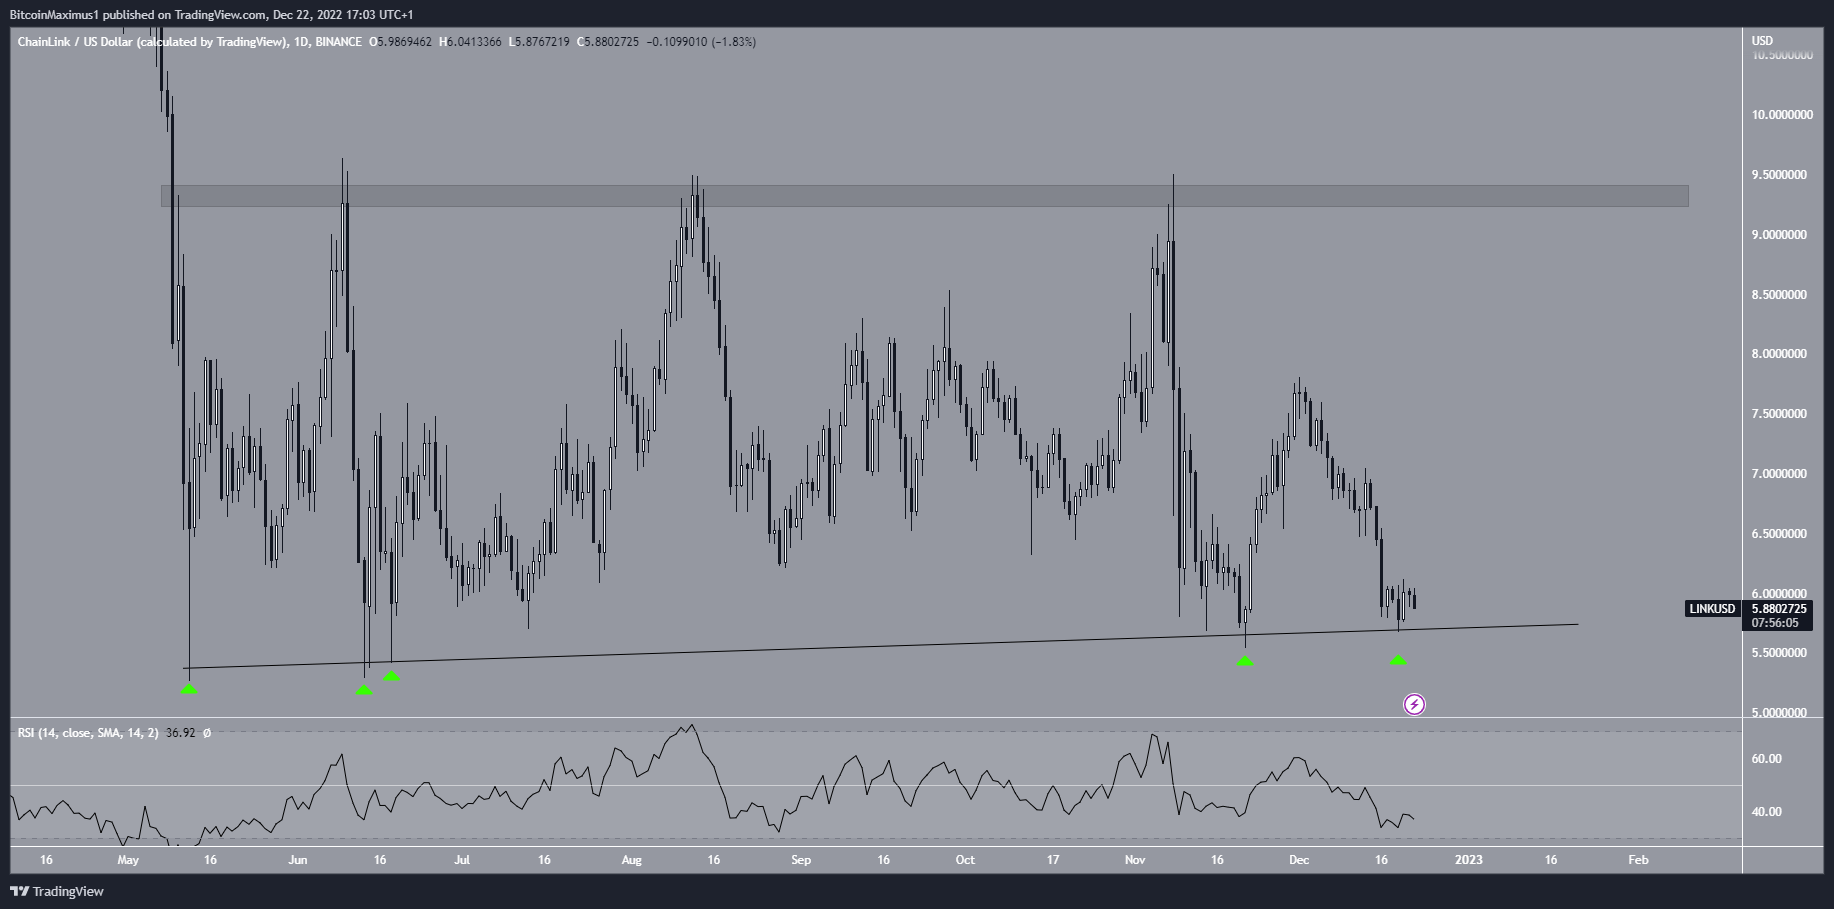
LINK/USD Daily Chart. Source: TradingView
Will Bullish Divergence Lead to Relief Rally?
While the daily time frame readings are leaning bearish, the six-hour chart suggests that an upward movement is expected. The main reason for this is the bullish divergence that has developed in the six-hour RSI (green line). Such divergences often precede upward movements.
As a result, the LINK price will likely increase to the descending resistance line, which has been in place since Nov. 8 and is currently at $6. If the Chainlink price breaks out from the line, it could increase toward the 0.382-0.5 Fib retracement resistance levels at $7.06-$7.53.
Conversely, failing to break out from the line and falling below the $5.67 lows would indicate that a breakdown from the long-term ascending support line could occur.
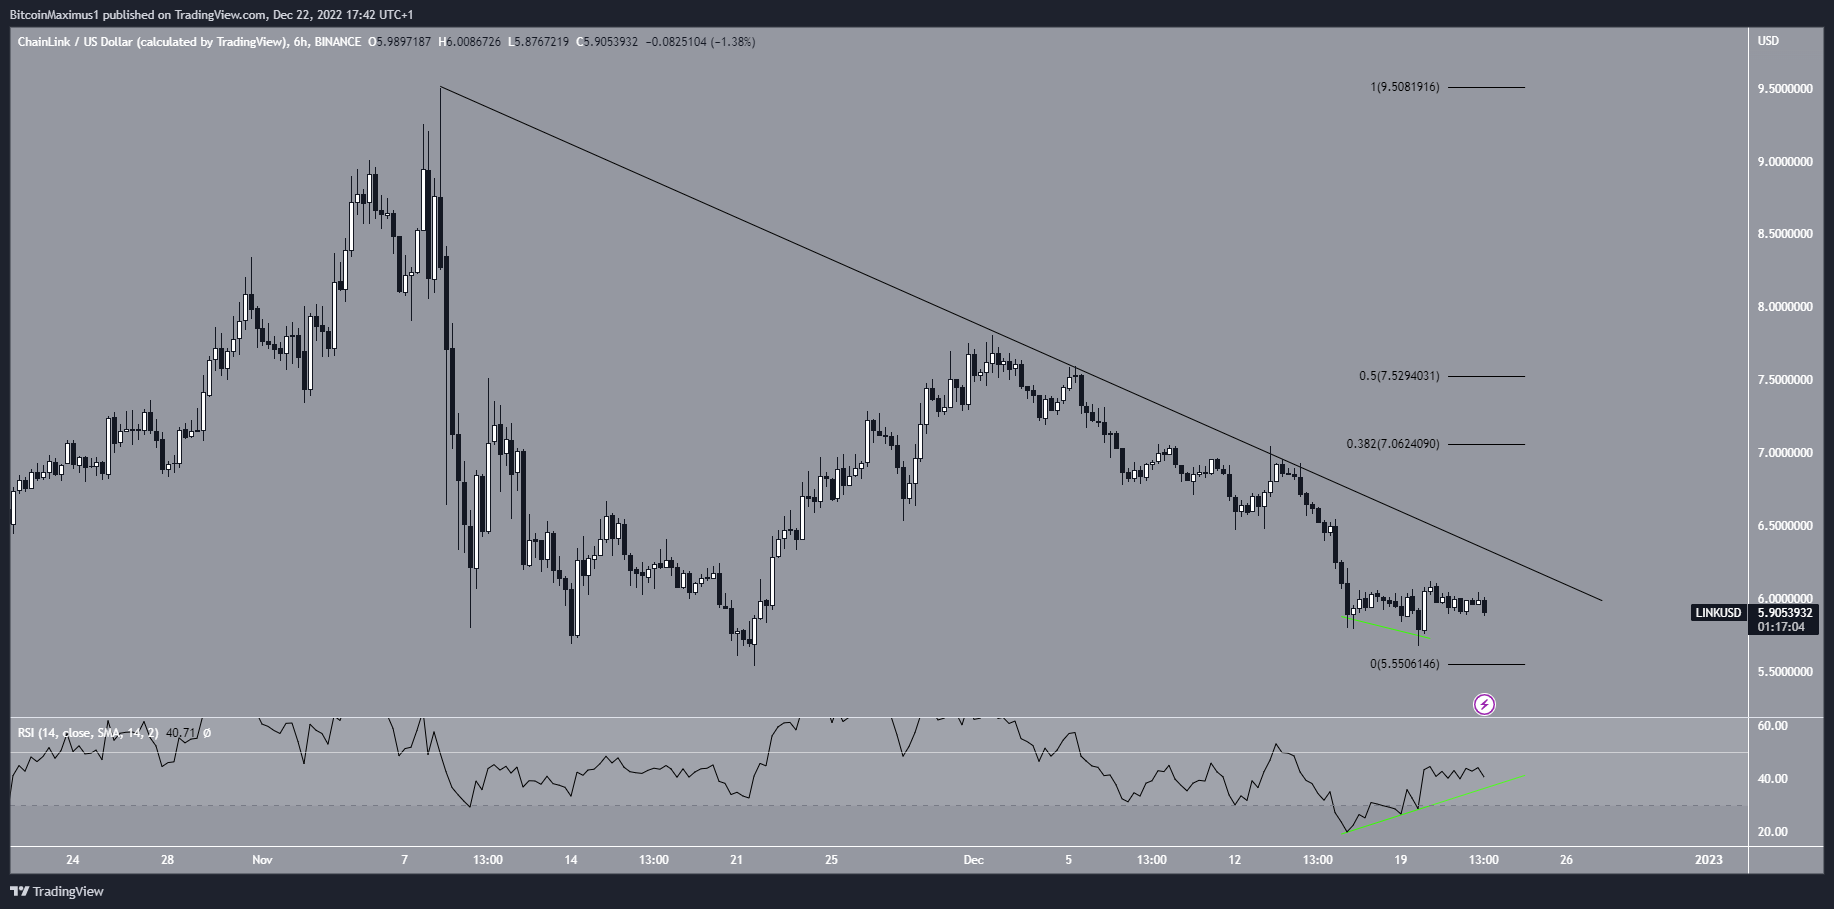
LINK/USD Six-Hour Chart. Source: TradingView
To conclude, the direction of the future Chainlink price movement is unclear. Whether the price breaks out from the short-term resistance line or gets rejected once more could help determine the future trend’s direction.


 Bitcoin
  Ethereum
  Tether
  USDC
USDC  Dogecoin
  Cardano
  Bitcoin Cash
  Polygon
  Litecoin
  LEO Token
  Hedera
  Stellar
  Cosmos Hub
  OKB
OKB  Maker
Maker  Algorand
  NEO
NEO  Gate
Gate  Synthetix Network
  KuCoin
  IOTA
IOTA  Tether Gold
  TrueUSD
  Enjin Coin
  Holo
Holo  Ravencoin
  0x Protocol
  Siacoin
  Basic Attention
  Ontology
  Zcash
Zcash  Decred
  Lisk
Lisk  Waves
Waves  DigiByte
  Status
  Numeraire
  Nano
Nano  Pax Dollar
  Steem
Steem  OMG Network
  BUSD
BUSD  Ren
Ren  Bytom
Bytom  Bitcoin Diamond
  HUSD
HUSD  Energi
  Augur
Augur