


Chainlink price analysis: Bullish pressure captures LINK market after a strong buying spree

Chainlink price analysis reveals the LINK market has experienced some buying activity, pushing the prices above $7.49 at the time of writing. The token is up by 3.27 percent in the last 24 hours and is trading in the $7.50 range. The support level for the LINK token is at $7.17, and if it fails to hold, this could be a sign of bearish momentum. On the upside, strong resistance is seen at $7.52, which should be broken for further bullish movement in the LINK market. The trading volume is also relatively high at $229 million, which may result in a further bullish trend. At the same time, the market capitalization of Chainlink has also increased to $3.87 billion, which suggests that buyers are still strong in the market.
Chainlink price analysis 1-day chart: LINK follows a bullish movement at $7.49
The 1-day Chainlink price analysis indicates the token opened the daily trading charts on a bullish note, hitting an intra-day high of $7.49. The token’s price then bounced off the crucial $7.17 support to start a rally higher, and it is currently trading above the $7.49 handle with bullish momentum. The bulls are trying to push the price above the $7.52 resistance level, which could potentially ignite a new uptrend in the LINK market.
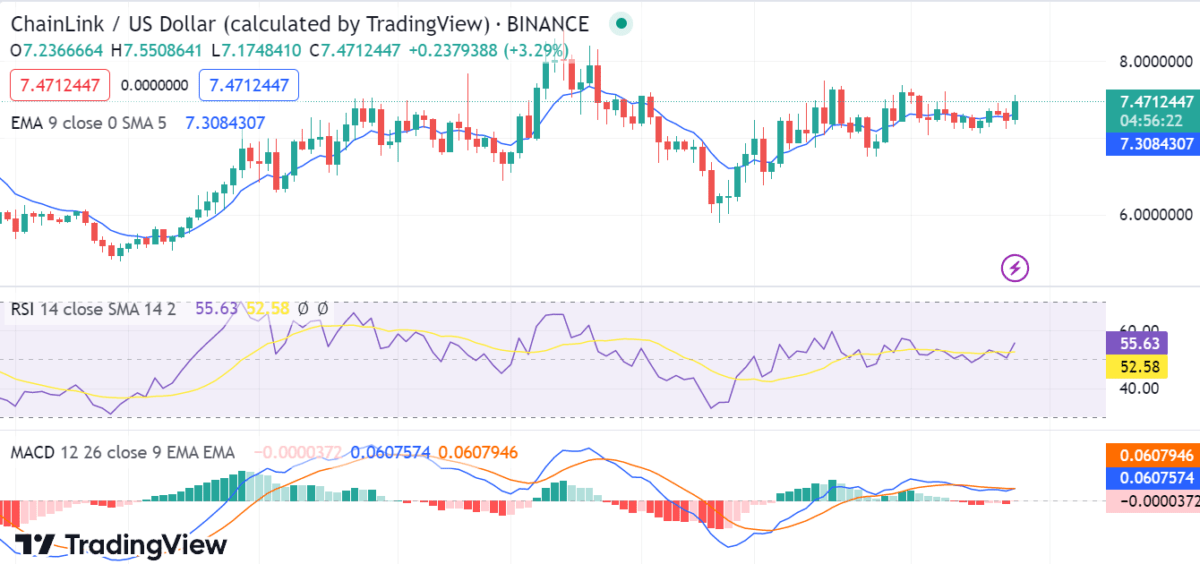
LINK/USD 1-day price chart, Source: TradingView
The technicals indicate the LINK token is trading above the 20-day EMA and 50-day EMA, which is a sign of bullish momentum. The token’s relative strength index (RSI) is trading at 55.63, which suggests that the token is neither in overbought nor oversold territory. The MACD line is trading above the signal line on the daily chart. The histogram further confirms the bullish sentiment in the market, as the bar is currently in the green color, which indicates an increase in buying pressure.
LINK/USD 4-hour price chart: Chainlink trades above the $7.49 level
The 4-hour Chainlink price analysis shows that the token has been trading in an ascending triangle pattern over the last week. If the bulls manage to break and sustain above the current resistance levels of $7.52, the LINK/USD pair could see further upward movement toward its next major resistance level at $7.62. The bulls are currently targeting a move above the $7.55 level to confirm a strong bullish trend in the near-term outlook.

LINK/USD 4-hour price chart, Source: TradingView
The MACD line is trading above the signal line, which is a sign of bullish momentum. The histogram bar is also green, which indicates that the buying pressure is increasing. The Relative Strength Index (RSI) is also bullish as it trades above the 60-level at $64.29 on the hourly chart. This suggests that there is still some buying pressure left in the market, and if this trend continues, then we could see further gains for Chainlink. The moving average is also bullish, as the 50-day and the 200-day are both trending above the current price.
Chainlink price analysis conclusion
In conclusion, Chainlink’s price analysis has seen an impressive price surge in recent hours, and it appears that the bulls are attempting to hold above $7.49 in order to push the price higher. The technical indicators are starting to show some bullish momentum, which could lead to further upside potential for the token in the near term.


 Bitcoin
  Ethereum
  Tether
  USDC
USDC  Dogecoin
  Cardano
  Bitcoin Cash
  Polygon
  Litecoin
  LEO Token
  Hedera
  Cosmos Hub
  Stellar
  OKB
OKB  Maker
Maker  Algorand
  NEO
NEO  Gate
Gate  KuCoin
  Synthetix Network
  IOTA
IOTA  Tether Gold
  TrueUSD
  Enjin Coin
  Holo
Holo  Ravencoin
  0x Protocol
  Siacoin
  Basic Attention
  Zcash
Zcash  Decred
  Lisk
Lisk  Ontology
  Waves
Waves  DigiByte
  Numeraire
  Nano
Nano  Pax Dollar
  Status
  Steem
Steem  OMG Network
  BUSD
BUSD  Ren
Ren  Bytom
Bytom  Bitcoin Diamond
  Augur
Augur  Energi
  HUSD
HUSD