


Dogecoin price analysis: DOGE breaks at $0.0883 as bullish momentum renews

Following a strong bullish trend, Dogecoin price analysis predicts a gain in price. Today, a significant price spike was seen, as the price levels surged to $0.0914. There has been a definite response from the bears as a strong correction followed suit soon after when they brought the price down to the current level of $0.083. The coin has, however, just regained some bullish momentum, and today’s trend is bullish as well. Further improvement is also anticipated given that bulls started the trading session with strong momentum and that the price is currently rising once again.
DOGE/USD 1-day price chart: Market maintains positive sentiment
The 1-day price chart for Dogecoin price analysis shows the cryptocurrency value is going towards the bullish side today. There has been a significant amount of momentum built on the side of bulls in the last week, after which bears were unable to respond with the same magnitude. However, the current trend indicates additional recovery around $0.0883, which is even higher than the mean average (MA) level, which is $0.0846; this is encouraging news for purchasers and has tipped the scales back in favor of the bulls.
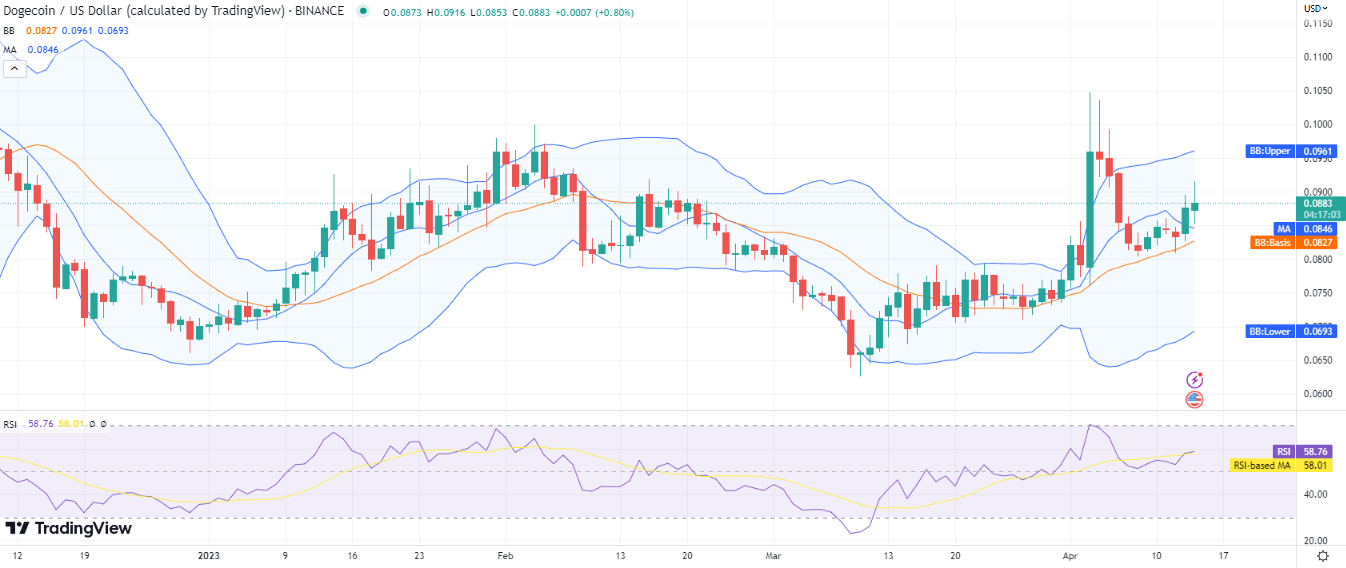
DOGE/USD 1-day price chart. Source: TradingView
Even if the volatility is high, which is a good indicator, the upper Bollinger band, which denotes resistance, is present at $0.0961, while the lower band, which denotes support for DOGE, is at $0.0693. As during the previous week, DOGE has seen tremendous recovery for bulls. The Relative Strength Index (RSI) score is at 58, which is substantially higher than it was yesterday. The RSI indicator’s curve is also upward, which suggests that buyers are active in the market.
Dogecoin price analysis: Recent developments and further technical indications
The bulls decisively overtook the bears on the 4-hour price chart, preventing them from moving further. The price jumped instantly to $0.0883 after a large spike, indicating that the momentum has been higher than usual. The coin value is still somewhat higher than the moving average, which is currently trading at $0.0881. The Bollinger bands mean average line, which is displayed on the chart beneath the MA value, also has an average value of $0.0854.
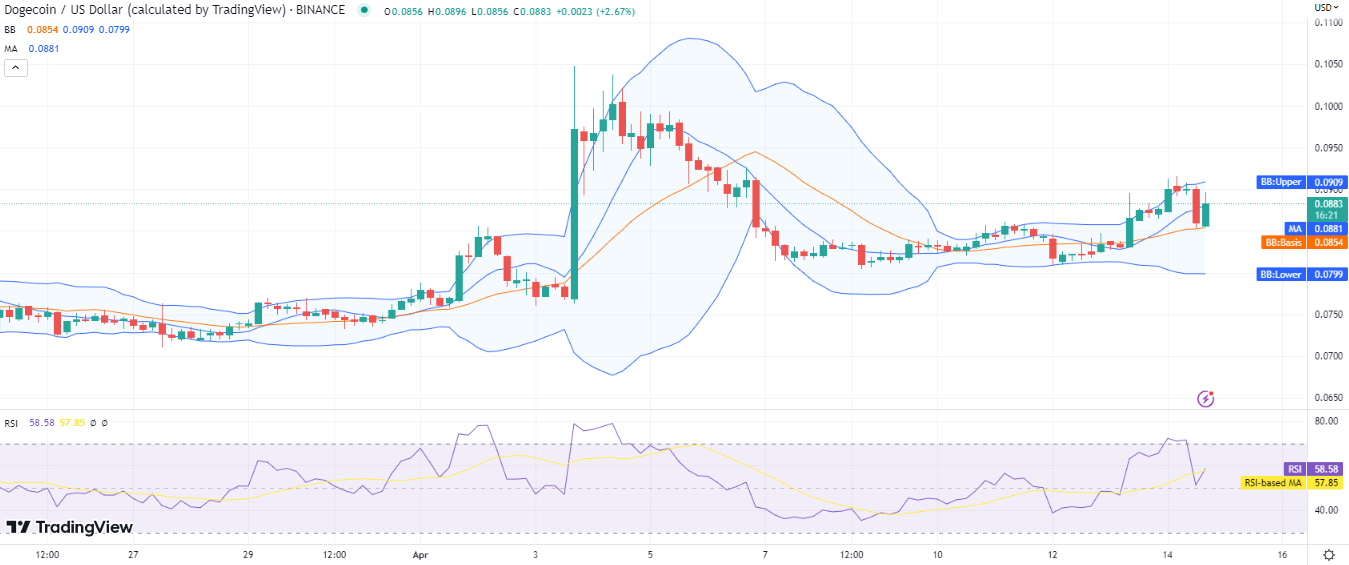
DOGE/USD 4-hours price chart. Source: TradingView
After forming a narrow channel earlier, the Bollinger bands are now diverging once more. Consequently, volatility has increased, as the upper band has reached $0.0909 and the lower band is at $0.0799. The RSI index has also gone up to 58. The RSI entered the overbought region today, but it descended under selling pressure and moved towards the neutral zone’s center. Nevertheless, the upward slope of its present curve indicates that buyers are making progress.
Dogecoin price analysis conclusion
From the above Dogecoin price analysis, it is evident that the bulls, who are in the majority, are seizing the lead. The current price levels, which have been rising since yesterday, are rising further as more buyers enter the market. For the upcoming 24 hours, we anticipate DOGE to continue its upward trajectory.


 Bitcoin
  Ethereum
  Tether
  USDC
USDC  Dogecoin
  Cardano
  Bitcoin Cash
  Polygon
  Litecoin
  LEO Token
  Hedera
  Stellar
  Cosmos Hub
  OKB
OKB  Maker
Maker  Algorand
  NEO
NEO  Gate
Gate  KuCoin
  Synthetix Network
  IOTA
IOTA  Tether Gold
  TrueUSD
  Holo
Holo  Enjin Coin
  0x Protocol
  Ravencoin
  Siacoin
  Basic Attention
  Ontology
  Zcash
Zcash  Decred
  Waves
Waves  Lisk
Lisk  DigiByte
  Nano
Nano  Status
  Numeraire
  Pax Dollar
  Steem
Steem  OMG Network
  BUSD
BUSD  Ren
Ren  Bytom
Bytom  Bitcoin Diamond
  HUSD
HUSD  Energi
  Augur
Augur