


ETC Technical Analysis: Extreme Selling May Trigger $20 Downfall

The ETC technical analysis offers a selling opportunity as the downtrend continues at breakneck speed to reach the psychological mark of $20. The ETC price action has recently rebounded from $44 and is heading to $20. The altcoin currently trades at $21 with an intraday fall of 10%. With sustained selling, the prices will drop under $20 to hit the $18 support level.
Key Points:
- The increased selling pressure plunges the Ethereum Classic market value under the $22 support zone.
- The death cross in the daily chart signals an extension in the correction phase.
- The intraday trading volume in Ethereum Classic is $425 Million.
Source-Tradingview
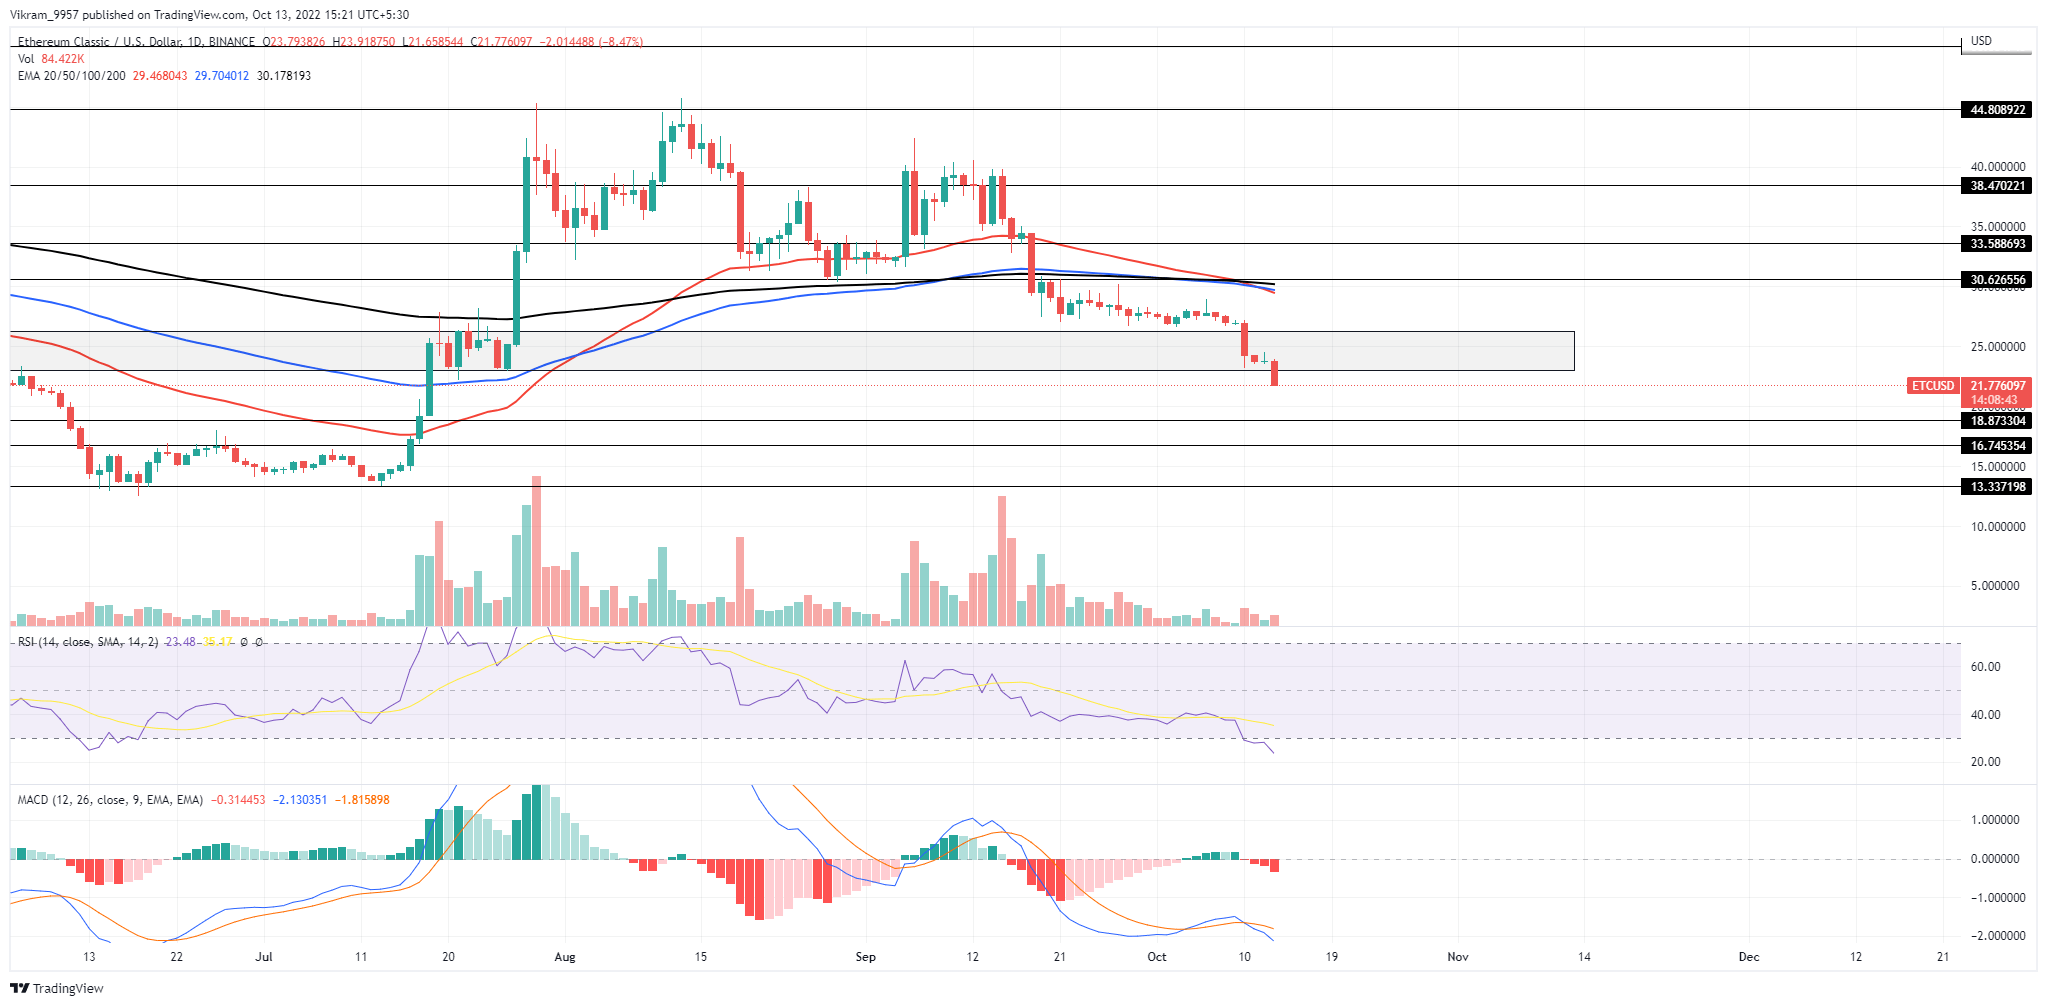
ETC Technical Analysis
The ETC price action has faced constant bursts of selling sprees after reversing from the overhead resistance of $44. Moreover, the ongoing bearish sentiment in the market fueled this downfall and plunged the market value by 46% last month. Additionally, the falling trend breaks below the $22 support zone and approaches the crucial $20 mark. As for now, the daily candle shows an intraday fall of 10.49% and trades at the $21 spot.

Source- TradingView On deeper analysis, the ETC price action shows the breakout of a falling channel with the daily candle. Additionally, this will prolong the correction phase if the candle closes below $22. Therefore, the sideline traders can find a bearish entry if the candle closes with a minimum lower price rejection. In such a case, the downtrend will breach the $20 mark to take support at the $18 horizontal level. Conversely, a bullish reversal above $22 will offset the bearish thesis if the market sentiment improves. This development could push prices higher within the bearish channel to hit the $30 mark.
Technical Indicator
The RSI indicator shows a sharp drop into the oversold zone with a declining trend in the 14-day SMA. However, the oversold nature teases a retest phase before falling under $20. Moreover, the bearish crossovers between the fast and slow lines indicate increased selling by market participants, which prolongs the correction. Therefore, the ETC technical analysis suggests traders can take bearish positions as the selling spree continues. Resistance levels- $22 and $25 Support levels- $20, $18


 Bitcoin
  Ethereum
  Tether
  USDC
USDC  Dogecoin
  Cardano
  Bitcoin Cash
  Polygon
  Litecoin
  LEO Token
  Hedera
  Cosmos Hub
  Stellar
  OKB
OKB  Maker
Maker  Algorand
  NEO
NEO  Gate
Gate  KuCoin
  Synthetix Network
  IOTA
IOTA  Tether Gold
  TrueUSD
  Enjin Coin
  0x Protocol
  Ravencoin
  Siacoin
  Holo
Holo  Basic Attention
  Zcash
Zcash  Decred
  Ontology
  Lisk
Lisk  Waves
Waves  DigiByte
  Numeraire
  Nano
Nano  Status
  Pax Dollar
  Steem
Steem  OMG Network
  BUSD
BUSD  Ren
Ren  Bytom
Bytom  Bitcoin Diamond
  HUSD
HUSD  Augur
Augur  Energi