


GMT Price Analysis: Is the GMT price facing severe resistance?

- The GMT price is currently trading at $0.379 while seeing a change of 0.83% in 24-hour trading volume.
- The GMT price is observing a decline of 1.01% in the last 24 hours.
The GMT price is still trading under the bear’s control below the 200 EMA. Although the price is making a higher high and higher low pattern testing the contently 100 EMA which suggests the bulls are attempting to cross above its current resistance. The slower-moving averages 100/50/20 EMA are also trading near each other making a convergence where the price is also making a consolidation which indicates that the GMT price can make a breakout in the near future.
The price after taking support from the $0.2200 level made a breakout through the resistance level. It also crossed above all the major 20/50/100 during which the price made an extremely bullish rally and gained more than 95 percent of its value back. Although the GMT price was not successful in crossing above its 200 EMA resistance despite the buyer’s strong support. And after taking the rejection the price took a sharp downfall of 52 percent.
GMT price facing resistance from the 100 EMA (Daily Timeframe)
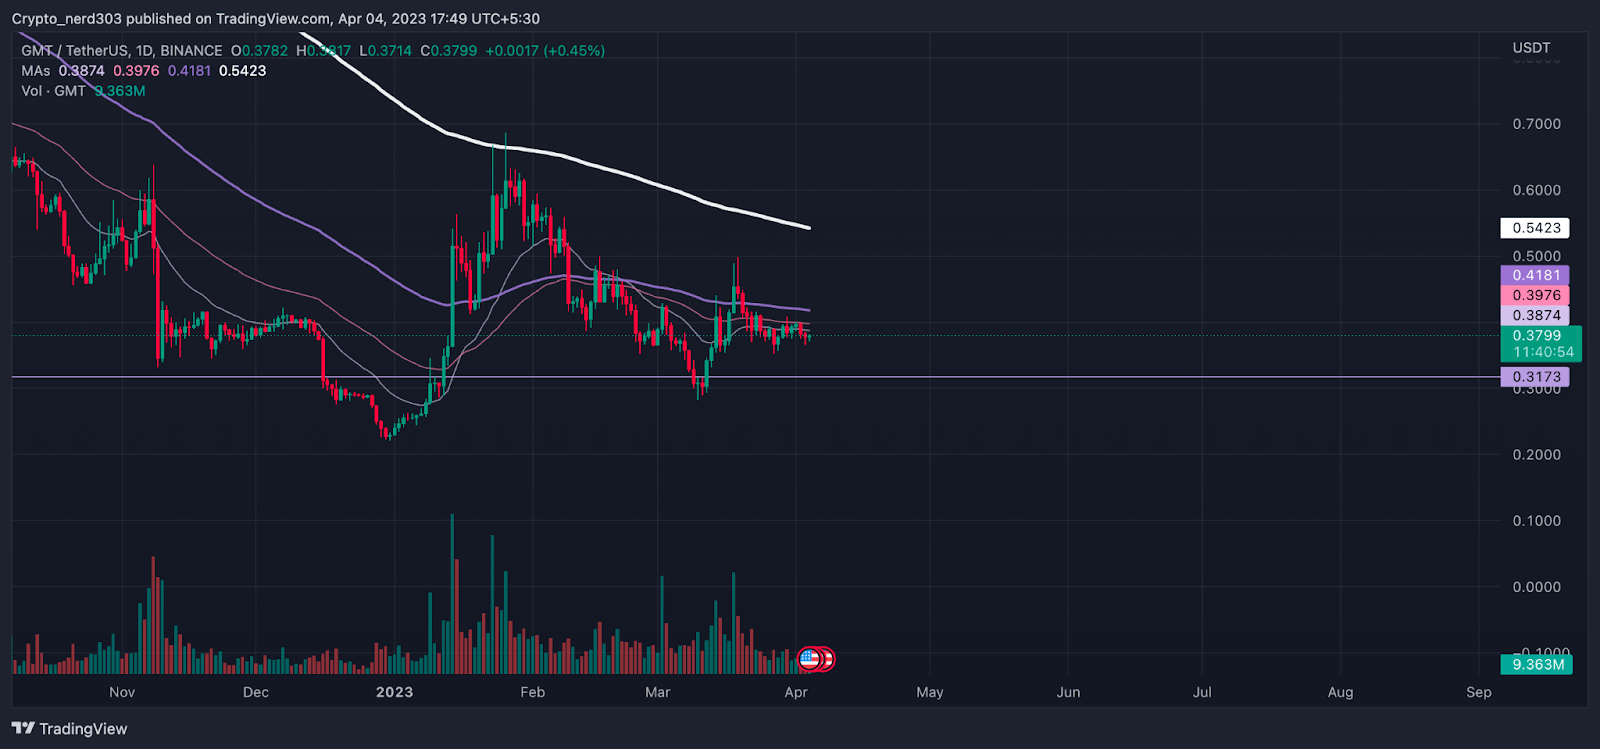
Source: GMT/USDT by TradingView
The overall market sentiments are currently trading near the greed zone 62 level. The greed and fear index is also observing a slight increase of 3 points since the last week when the market sentiments were around 59 points according to the Alternative(dot)me a platform. The GMT price is currently observing a struggle between buyers and sellers across most of the major cryptocurrency exchange platforms where the buyers have a majority of 50 to 69 percent on some platforms and the sellers are overwhelming 52 to 62 percent on others according to Coinglass.
Technical Analysis ( 1 Day Timeframe )
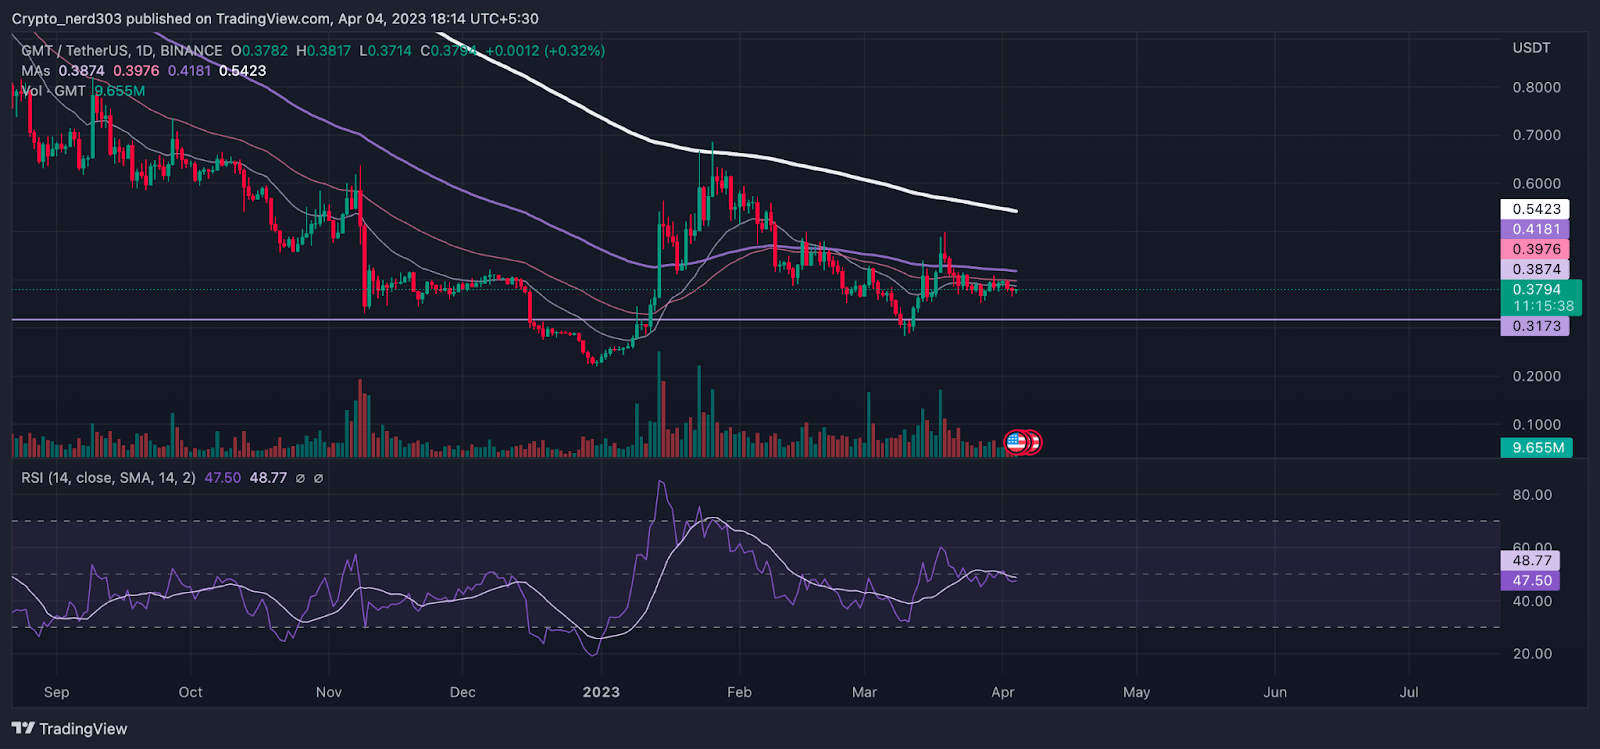
Source: GMT/USDT by TradingView
The RSI line is currently trading near the median line while following the price consolidation. The current value of RSI is 47.50 points which is trading below the 47 SMA trading around 48.77 points. The RSI line can start moving towards the undersold levels as it is facing resistance from the 14 SMA.
Conclusion
The GMT price is currently trading under the bear’s influence where it is also facing severe resistance from the 200 EMA. As the price is currently consolidating below the 100 EMA and facing resistance from the 200 EMA it can be assumed that the price may start making a bearish correction. Although the overall trend of GMT is bullish. It can make a bearish correction of 30 percent.
Technical levels –
Support -$110.0
Resistance – $140.0
Disclaimer
The views and opinions stated by the author, or any people named in this article, are for informational purposes only and do not establish financial, investment, or other advice. Investing in or trading crypto assets comes with a risk of financial loss.


 Bitcoin
  Ethereum
  Tether
  USDC
USDC  Dogecoin
  Cardano
  Bitcoin Cash
  Polygon
  Litecoin
  LEO Token
  Hedera
  Cosmos Hub
  Stellar
  OKB
OKB  Maker
Maker  Algorand
  NEO
NEO  Gate
Gate  KuCoin
  Synthetix Network
  IOTA
IOTA  Tether Gold
  TrueUSD
  Enjin Coin
  Holo
Holo  Ravencoin
  0x Protocol
  Siacoin
  Basic Attention
  Decred
  Zcash
Zcash  Ontology
  Lisk
Lisk  Waves
Waves  DigiByte
  Numeraire
  Nano
Nano  Status
  Pax Dollar
  Steem
Steem  OMG Network
  BUSD
BUSD  Ren
Ren  Bitcoin Diamond
  Bytom
Bytom  Augur
Augur  Energi
  HUSD
HUSD